It is generally considered good practise with Subversion to keep trunk for stable useable code, and create a development branch from trunk for new development. The new development may be used, for example, to code a new feature, to perform release stabilization, or to experiment with refactoring, and will be merged back into the main branch when the work is complete.
Working on the msp432logger project, I wanted to refactor the code to create a distinct logging application, separate from the driver level, and created a new branch for the work called TRY-loggerapp.
Create a development branch
I’m following Subversion best practices for my project directory structure, using trunk, tags and branches sub-directories.
Foresight
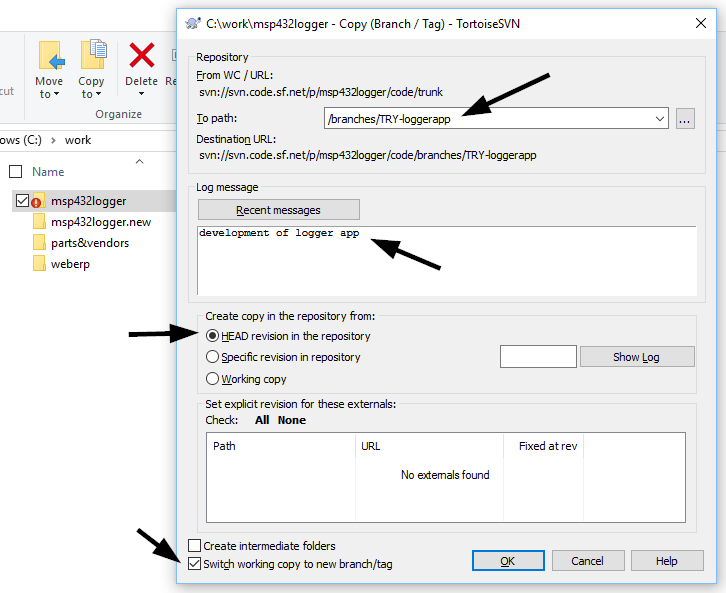
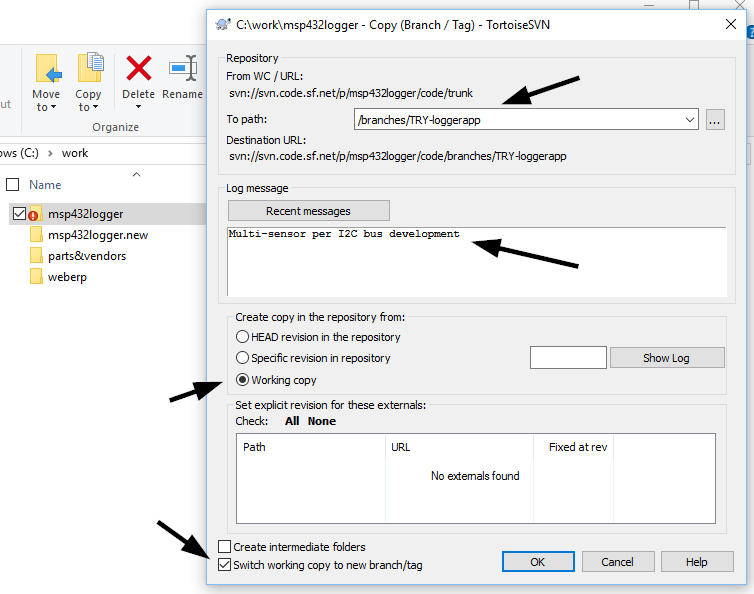
Right-click on the local repository workspace folder in Windows Explorer and pick TortoiseSVN -> Branch/tag… from the Context menu. Select the path for the branch, a log message, and the base for the branch. You can select HEAD or a specific version to base the branch on. If there are no edited files in the working copy, the Copy dialog will default to using the most recent version as the base for the branch.
Hindsight
If you are creating the branch in hindsight and have already made file edits, TortoiseSVN will warn you that basing the branch on HEAD will result in loss of those edits.
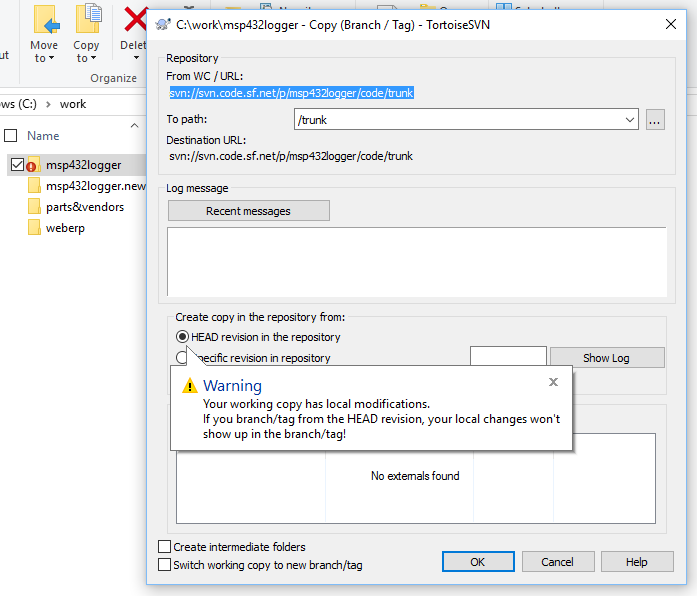
In this case, you will likely want your edits (and any new files) to become the first commit in the new branch. In this case, close the warning and select Create copy in the repository from: Working copy.
Work in the dev branch
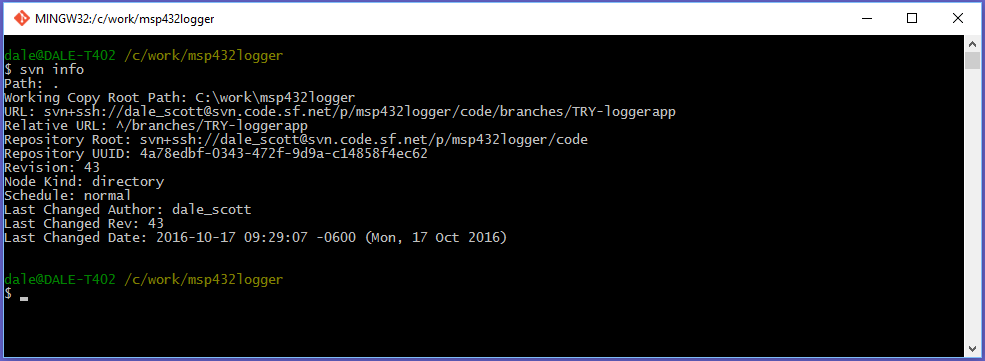
I selected Switch working copy to new branch/tag in the Copy dialogue when I created the branch. The current branch in the working copy can be verified using the svn info cli command.
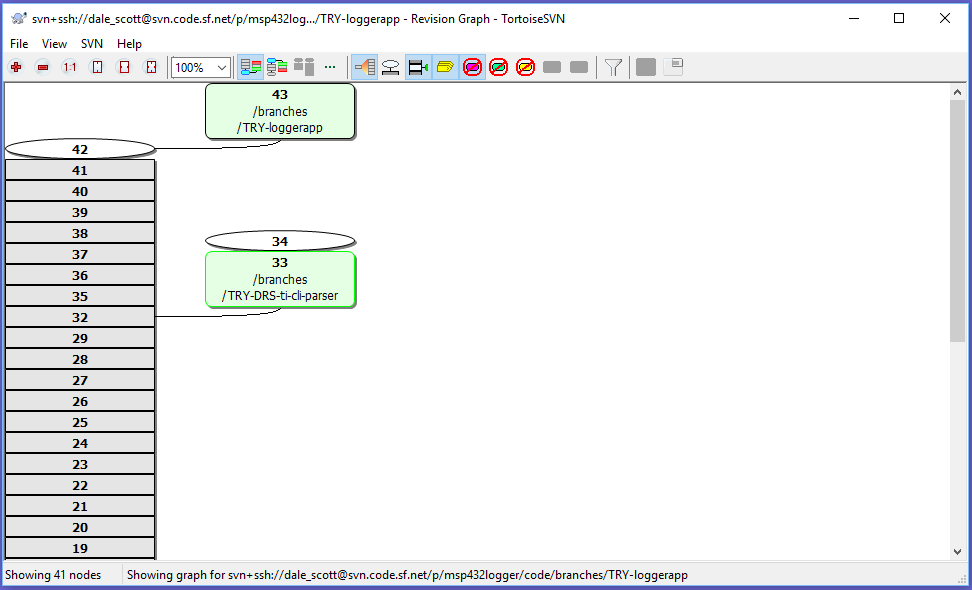
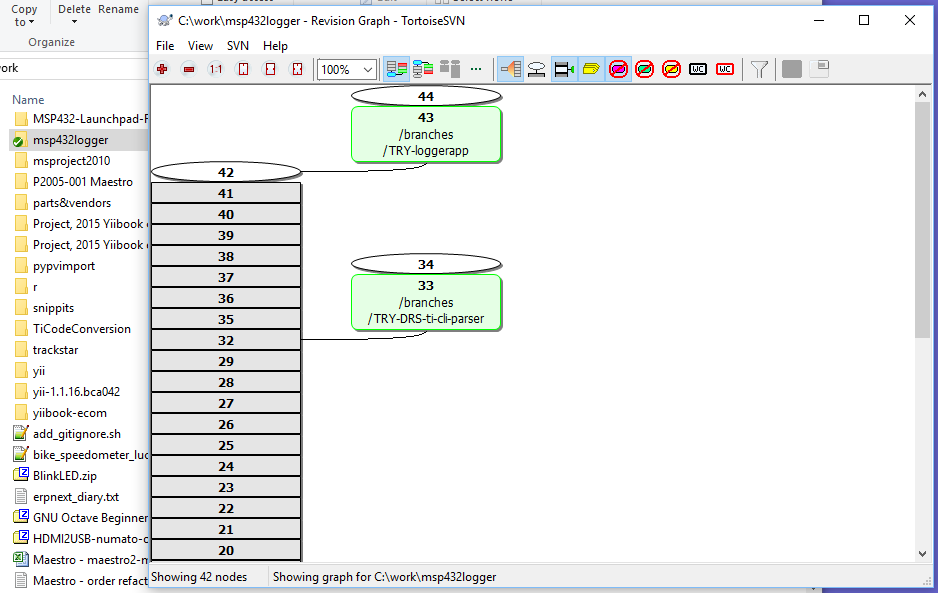
You can also see the new branch in TortoiseSVN’s Revision Graph.
If I hadn’t checked Create copy in the repository from: Working copy when I created the branch, I would have had to Switch to the branch in a separate step.
Right-click on the local repository workspace folder in Windows Explorer and pick TortoiseSVN -> Switch… from the Context menu, and select the path for the branch to switch to.
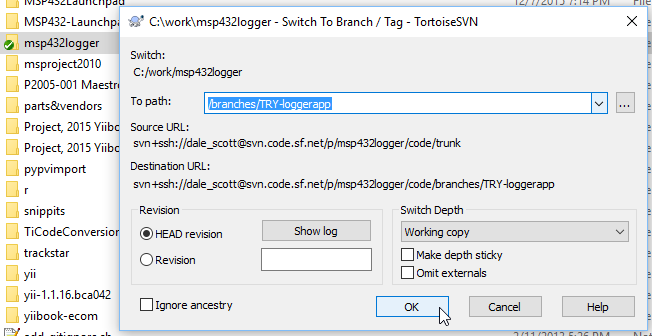
You can confirm your working copy has switched to the desired branch using the Subversion cli command “svn info” as previously described before continuing development in the new branch.
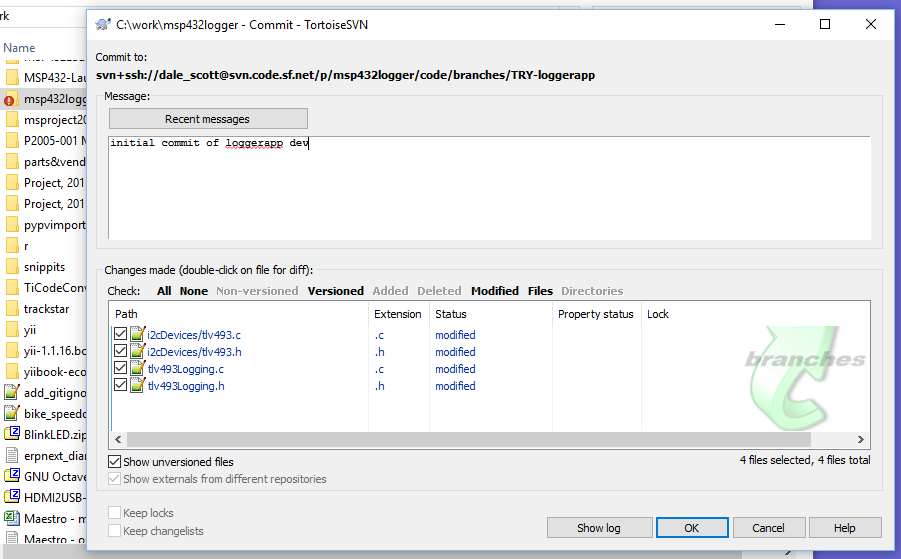
Checking in code is as before, but first check the Commit to: line at the top of the Commit dialogue to confirm the code will be checked into the correct branch.
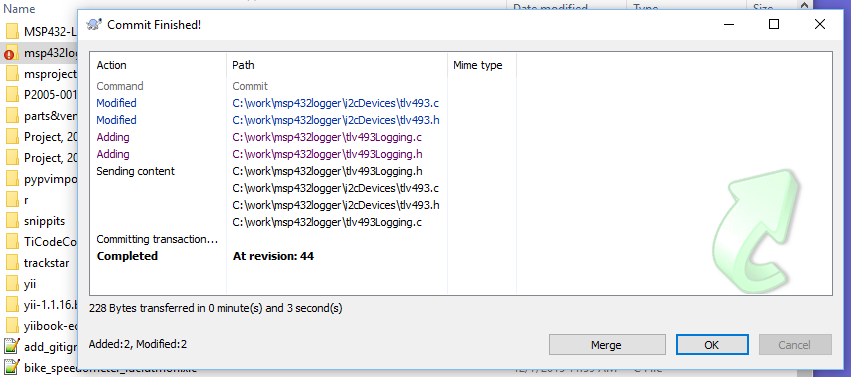
After clicking OK, you should see that the check-in completed successfully.
and the Revision Graph now includes the check-in.
Merge dev branch back into trunk
Eventually you want to merge the development branch back into trunk. The preferred method is to start with a clean working copy, check out the branch to merge into (i.e. check out trunk), then use the TortoiseSVN Merge Wizard to merge the desired branch into trunk.
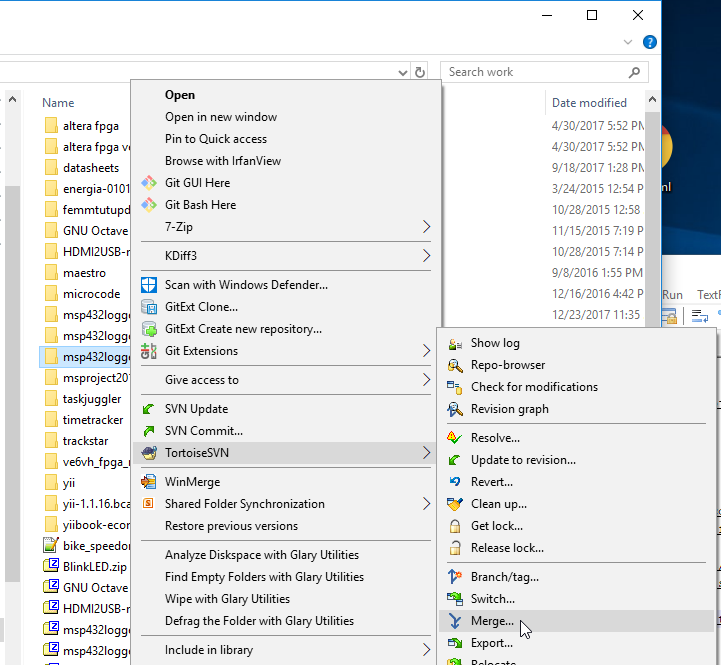
Start the Merge Wizard.
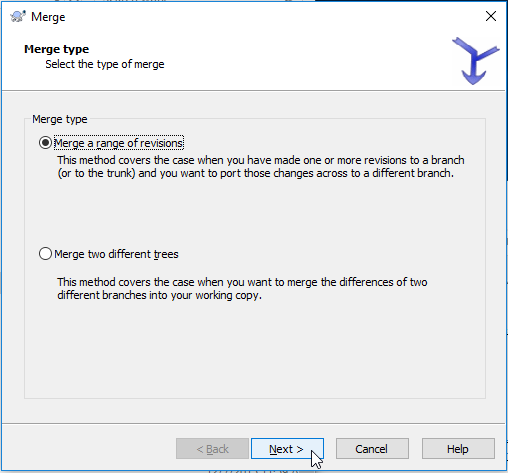
Select Merge Range of Revisions.
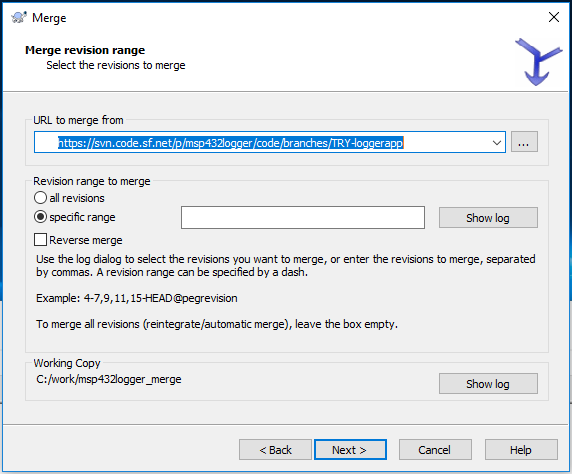
Select the branch to merge into the current branch.
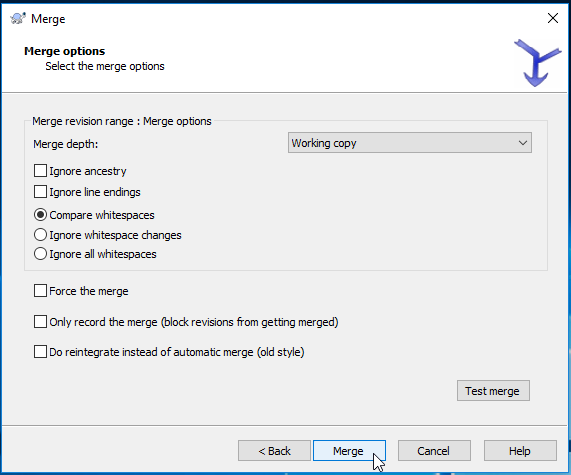
Options will not be necessary for basic operation.
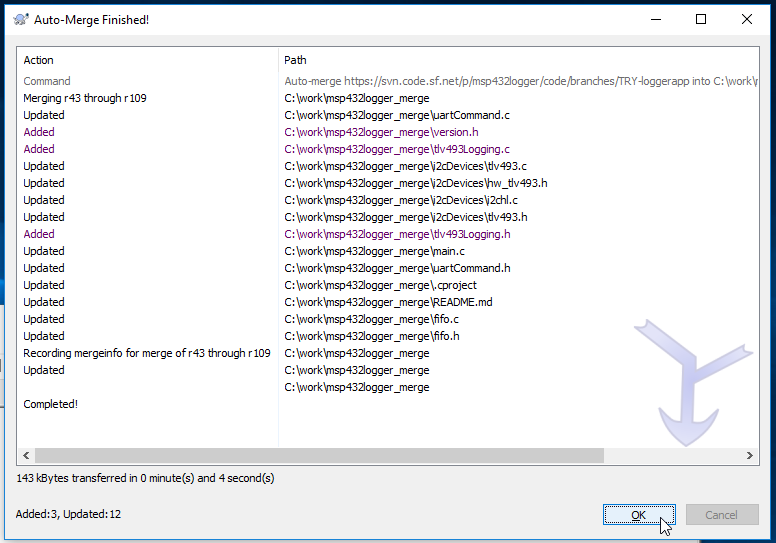
The results of the auto-merge will be shown.
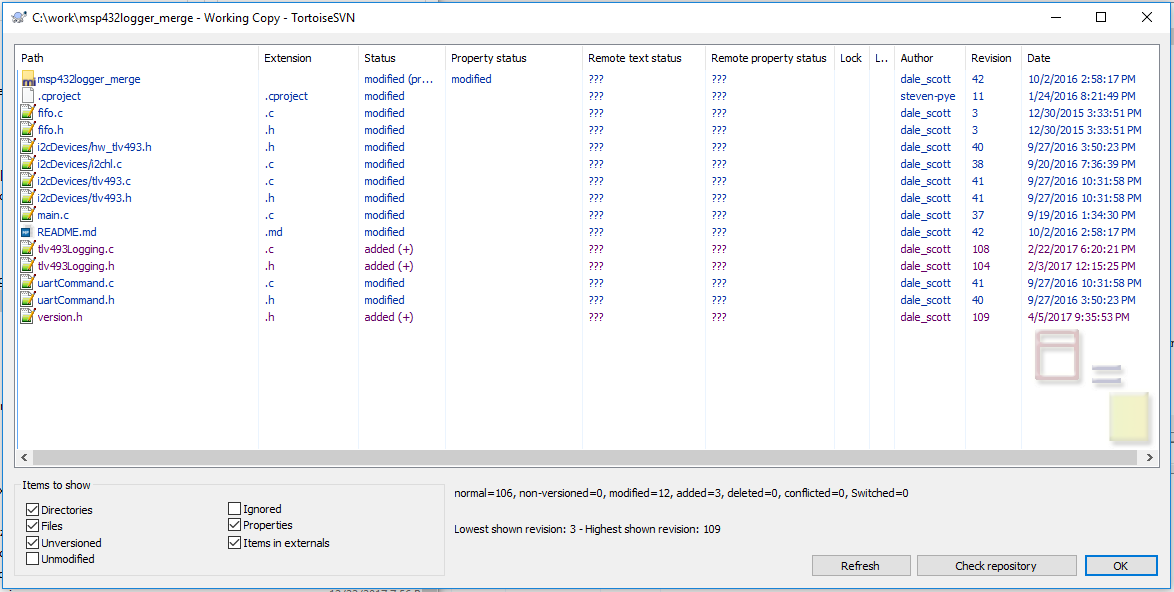
The working copy is now modified with the results of the merge.
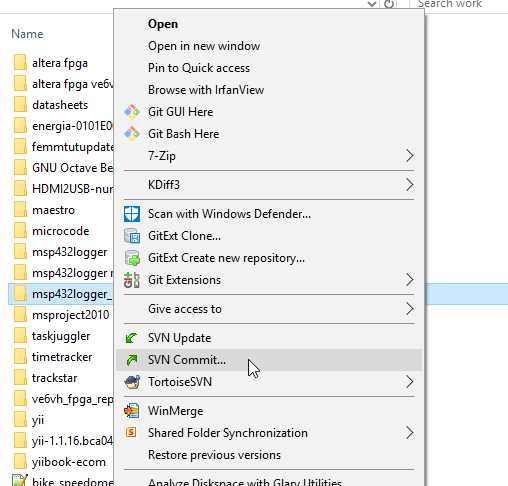
Test the modified working copy as needed, then commit the modified trunk branch back to the project.
Easy Peasy!
Cheers,
Dale