Install PyCharm Community on Linux Mint 21.3

The Linux Mint Software Manager includes the popular Python IDE PyCharm Community, but it’s a Flathub Flatpak and cannot access Python modules installed by Software Manager as System Packages.

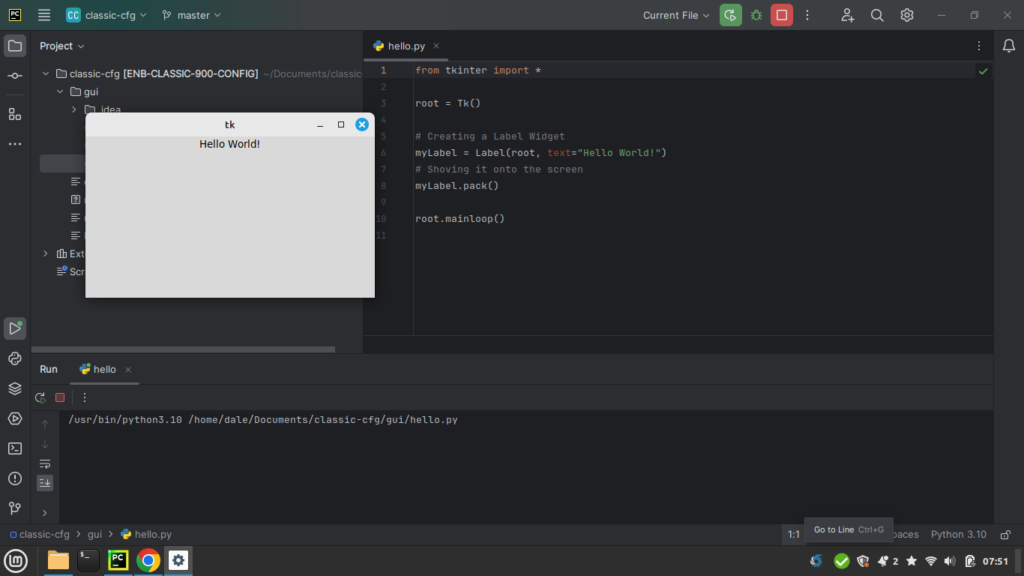
For example, after using Software Manager to install Python3 and Python3-tk (System Packages) and PyCharm Community (Flathub Flatpak), try running a simple “Hello, world!” script in PyCharm that opens a Tkinter window:

import tkinter as tk

root = tk.Tk()

w = tk.Label(root, text="Hello, world!")
w.pack()

root.mainloop()

Instead of a Tkinter window appearing, PyCharm shows the error:

ModuleNotFoundError: No module named 'tkinter'

The error is because the execution environment of the PyCharm Flatpak is separate from the main system, where the tkinter module has been installed.

I’m sure there are other solutions and workarounds, but the simplest solution for me was switching to the official tarball release from JetBrains. PyCharm from the JetBrains release will execute in the main system and have access to all the modules installed there.

Download the release .tar.gz archive for Linux from JetBrains (https://www.jetbrains.com/pycharm/download/?section=linux). After it has downloaded, navigate to your ~/Downloads directory using the GUI file manager (Nemo) and double-click the archive to open it in Archive Manager. Drag the “pycharm-community-yyyy-x.y” folder from Archive Manager to a convenient location where PyCharm will be executed from (I put the folder in my home directory, aka ~ aka /home/username/).

As described in the Install-Linux-tar.txt file in the archive, PyCharm is executed using the bin/pycharm.sh shell script. The first time PyCharm is executed it will create configuration files stored in ~/.config/JetBrains/… (the Install-Linux-tar.txt file has more details).

For convenience, I added the path to pycharm.sh to my bash shell path so I can execute PyCharm from a terminal session without having to remember the full path. To do this, I added the following line to the end of ~/.bashrc:

export PATH="$HOME/bin:$HOME/pycharm-community-2023.3.3/bin:$PATH"

I also added a menu entry for PyCharm to the Programming folder in the Linux Mint menu for convenient desktop access.

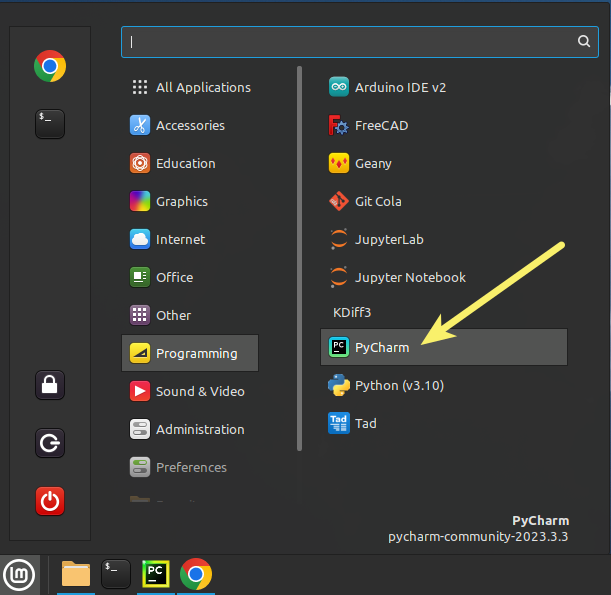
To do this, right-click on the Linux Mint menu button and select Configure, then Menu, Open the menu editor, Programming folder and finally New Item. Click the Browse button and browse to pycharm.sh to create the command line, enter a Name (and if you wish a comment), click the icon box and search for a PyCharm logo, leave the “Launch in terminal” box unchecked, and finally click OK to close the menu editor. For more detailed instructions, search the web for adding a launcher to the Linux Mint menu.

Now PyCharm has no trouble opening a Tkinter window.

Accessing the Catnip Electronics RS485 Modbus Moisture Sensor using Python3

Catnip Electronics makes a robust capacitive moisture sensor with a Modbus RS-485 interface which allows the sensor to be over 1000m from the computer accessing the sensor (subject to cable properties and baud rate). This post is essentially an update to Catnip’s Rasberry Pi tutorial using Python 2 using Python3 on my Linux Mint laptop.

To connect to the moisture sensor, I will use the Taobao USB to RS-485 adapter sold by Catnip Electronics.

Start by installing python3-pip.

dale@firefly:~$ sudo apt-get install python3-pip
Reading package lists... Done
Building dependency tree       
Reading state information... Done
The following additional packages will be installed:
  build-essential g++ g++-9 libpython3-dev libpython3.8-dev libstdc++-9-dev python3-dev python3-setuptools
  python3-wheel python3.8-dev
Suggested packages:
  g++-multilib g++-9-multilib gcc-9-doc libstdc++-9-doc python-setuptools-doc
The following NEW packages will be installed:
  build-essential g++ g++-9 libpython3-dev libpython3.8-dev libstdc++-9-dev python3-dev python3-pip
  python3-setuptools python3-wheel python3.8-dev
0 upgraded, 11 newly installed, 0 to remove and 0 not upgraded.
Need to get 15.2 MB of archives.
After this operation, 70.0 MB of additional disk space will be used.
Do you want to continue? [Y/n] Y
...
dale@firefly:~$ 

Next, install the chip_modbus library (“Chirp” was the original I2C moisture sensor from Catnip Electronics, which was upgraded to become the Modbus sensor).

dale@firefly:~$ sudo pip install chirp_modbus
[sudo] password for dale:          
Collecting chirp_modbus
  Downloading chirp_modbus-1.0.2.tar.gz (2.5 kB)
Collecting minimalmodbus>=1.0.2
  Downloading minimalmodbus-2.0.1-py3-none-any.whl (33 kB)
Collecting pyserial>=3.0
  Downloading pyserial-3.5-py2.py3-none-any.whl (90 kB)
     |████████████████████████████████| 90 kB 1.9 MB/s 
Building wheels for collected packages: chirp-modbus
  Building wheel for chirp-modbus (setup.py) ... done
  Created wheel for chirp-modbus: filename=chirp_modbus-1.0.2-py3-none-any.whl size=2720 sha256=4a869530f8de35b421d5556e1677ca1d760bb48f7107510d6e8946b5130e7128
  Stored in directory: /root/.cache/pip/wheels/b8/e4/54/e09426372abf3522455f8c54ec6b7988e9f1c5e7a5a2f9b61d
Successfully built chirp-modbus
Installing collected packages: pyserial, minimalmodbus, chirp-modbus
Successfully installed chirp-modbus-1.0.2 minimalmodbus-2.0.1 pyserial-3.5
dale@firefly:~$ 

Now use the Python shell to access the sensor (on my laptop, the USB to RS-485 adapter is assigned port /dev/ttyUSB0).

dale@firefly:~$ python3
Python 3.8.10 (default, Mar 15 2022, 12:22:08) 
[GCC 9.4.0] on linux
Type "help", "copyright", "credits" or "license" for more information.
>>> import chirp_modbus
>>> sensor = chirp_modbus.SoilMoistureSensor(address=1, serialport='/dev/ttyUSB0')
>>> sensor.getMoisture()
277
>>> sensor.getTemperature()
25.1
>>> 
dale@firefly:~$ 

The chip_modbus library includes a number of other functions, view the source to see all capabilities.

MyWind MariaDb / MySQL Database

I was both surprised and pleased to see a flury of recent interest in my MyWind database on GitHub, there have been 18 forks in the last month!

MyWind is a re-engineering of the Northwind database provided with Microsoft Access for use with MariaDb and MySQL. Northwind was a sample database and tutorial schema for managing small business customers, orders, inventory, purchasing, suppliers, shipping, and employees.

I provided MyWind using the BSD license, meaning you are free to use MyWind as you please, including commercially, so long as you keep my copyright notice and accept my disclaimer of liability. Enjoy!

Using GTKWave and DatPlot to View Time Series Data

Sensor-based IoT devices often measure attributes of their environment, such as temperature, battery voltage, signal strength, etc. This data can be presented as a time series, which is a sequence of values obtained at successive points in time. The time between values may be fixed, such as every 1 ms, or it may be irregular or event-driven, such as only times when the value exceeded some threshold.

Many times it can be instructive to view time series data graphically to more readily perceive “the big picture”. Time series data can be plotted using a spreadsheet program (e.g. Excel®) or general purpose numerical analysis application (e.g. R and MATLAB®-compatible GNU Octave). However, a domain-specific program can focus on the job at hand and be more effective.

I naively first thought there would be no shortage of open-source or free-for-use applications to select from, but web searching proved that was not the case. When my eyes started to blur, only GTKWave and DatPlot appeared potentially suitable.

GTKWave

GTKWave was originally developed for viewing Verilog digital-only circuit simulations, although it now can also display real-valued signals. GTKWave will read Verilog VCD/EVCD format files, as well as LXT, LXT2, VZT, FST, and GHW formats. It is provided under the GPL open-source license, and is cross-platform (BSD/Linux, 32-bit Windows®, and OS X®).

GTKWave supports dynamic zooming and panning, has a time marker to display values at a specific time, and can be used with datafiles too large to fit into memory without loss of usability. It is also possible to use GTKWave with streaming data instead of a static input file. However, GTKWave will not read simple delimited text data, such as a CSV-format file. Also, while the vertical axis scales automatically based on the value range of a signal, the scale is not labelled and cannot be set manually.

Based on the user manual and provided data files, GTKWave appears to be useable with a large number of signals and very large data sets. The following screenshot shows the magnetic field around a small toroidal magnet.

tlv493-arduino-02-gtkwave

DatPlot

DatPlot was developed by an aerospace engineer as a better solution for visualizing flight test. The DatPlot tagline is From raw data to report ready plots in under five minutes. Like GTKWave, DatPlot supports dynamic zooming and panning and the vertical plot axis scales automatically like GTKWave, but unlike GTKWave the vertical axis is labelled and an arbitrary number of time markers (called Event Lines) can be displayed. In addition, DatPlot supports annotations which can be used to improve clarity. DatPlot is not open-source, although it is still free to use.

I have not yet been able to explore the usability of DatPlot with a large number of signals (Data Curves) or with very large data sets. The following screenshot again shows the 3D magnetic field around a small toroidal magnet (although not the same dataset shown by GTKWave).

tlv493-arduino-03-datplot

Summary

While GTKWave showed promise based on support for very large data sets, and for being open-source, its lack of vertical scale ultimately made it unacceptable for my immediate use case. GTKWave’s lack of support for simple delimited text files was only a minor inconvenience, as it was not difficult to write data values to a VCD-format data file.

DatPlot does what it claims to do, and is a nice compromise between static graph creation and interactive analysis. I will continue using DatPlot, but a few additional features would really make it shine.

  • Paging quickly forwards and backwards in time (e.g. by holding down Page Up or Page Down keys, instead of only being able to drag left or right in a Graph Pane).
  • Display a specific time in a dataset (instead of dragging to the desired point).
  • Support for CLI operation (e.g. using command parameters or a parameter file to specify source data file, desired Graph Panes and Data Curves, and output image file name).

Epilogue

During my research into a time series data viewing, I came across ROS.org (Robot Operating System). ROS uses bag files to store serialized ROS message data, and provides rqt_bag and rqt_plot utilities to view the data, including plotting fields on a graph. Embedded systems in general (not just robots) often need to store system messages for debugging or forensic analysis, and using the existing ROS bag-file and utilities could save significant effort compared to developing a similar system from scratch.