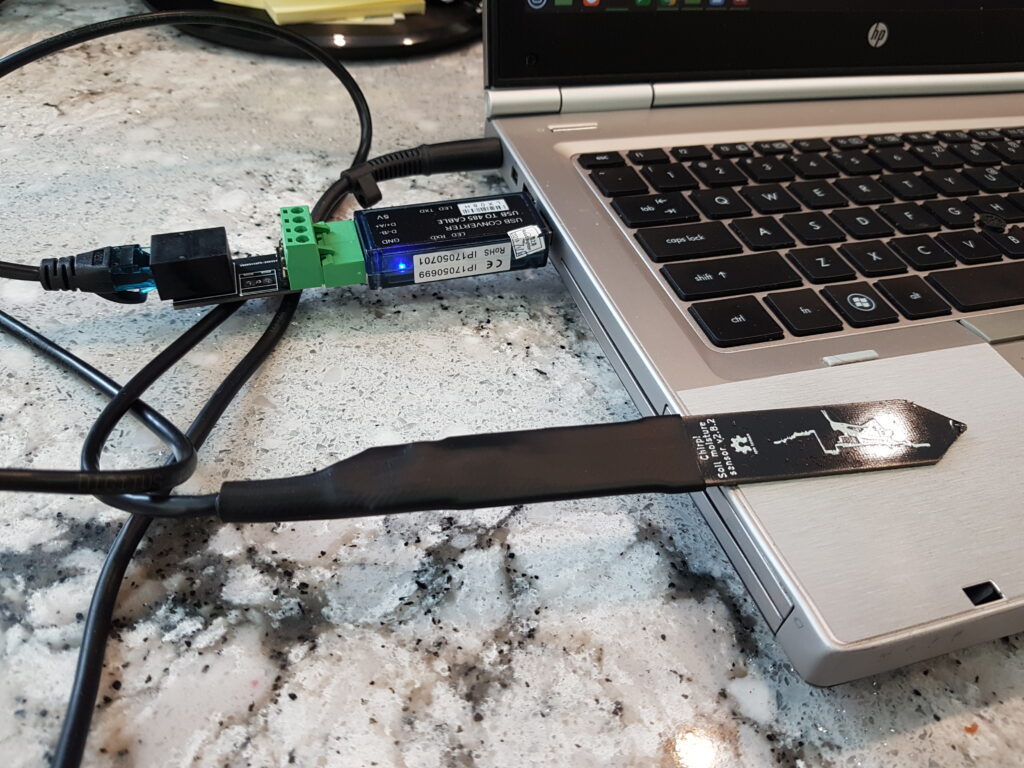
Catnip Electronics makes a robust capacitive moisture sensor with a Modbus RS-485 interface which allows the sensor to be over 1000m from the computer accessing the sensor (subject to cable properties and baud rate). This post is essentially an update to Catnip’s Rasberry Pi tutorial using Python 2 using Python3 on my Linux Mint laptop.
To connect to the moisture sensor, I will use the Taobao USB to RS-485 adapter sold by Catnip Electronics.
Catnip Electronics RS-485 Moisture Sensor and USB-to-RS-485 Adapter Dongle
Start by installing python3-pip.
dale@firefly:~$ sudo apt-get install python3-pip
Reading package lists... Done
Building dependency tree
Reading state information... Done
The following additional packages will be installed:
  build-essential g++ g++-9 libpython3-dev libpython3.8-dev libstdc++-9-dev python3-dev python3-setuptools
  python3-wheel python3.8-dev
Suggested packages:
  g++-multilib g++-9-multilib gcc-9-doc libstdc++-9-doc python-setuptools-doc
The following NEW packages will be installed:
  build-essential g++ g++-9 libpython3-dev libpython3.8-dev libstdc++-9-dev python3-dev python3-pip
  python3-setuptools python3-wheel python3.8-dev
0 upgraded, 11 newly installed, 0 to remove and 0 not upgraded.
Need to get 15.2 MB of archives.
After this operation, 70.0 MB of additional disk space will be used.
Do you want to continue? [Y/n] Y
...
dale@firefly:~$
Next, install the chip_modbus library (“Chirp” was the original I2C moisture sensor from Catnip Electronics, which was upgraded to become the Modbus sensor).
dale@firefly:~$ sudo pip install chirp_modbus
[sudo] password for dale:
Collecting chirp_modbus
  Downloading chirp_modbus-1.0.2.tar.gz (2.5 kB)
Collecting minimalmodbus>=1.0.2
  Downloading minimalmodbus-2.0.1-py3-none-any.whl (33 kB)
Collecting pyserial>=3.0
  Downloading pyserial-3.5-py2.py3-none-any.whl (90 kB)
     |████████████████████████████████| 90 kB 1.9 MB/s
Building wheels for collected packages: chirp-modbus
  Building wheel for chirp-modbus (setup.py) ... done
  Created wheel for chirp-modbus: filename=chirp_modbus-1.0.2-py3-none-any.whl size=2720 sha256=4a869530f8de35b421d5556e1677ca1d760bb48f7107510d6e8946b5130e7128
  Stored in directory: /root/.cache/pip/wheels/b8/e4/54/e09426372abf3522455f8c54ec6b7988e9f1c5e7a5a2f9b61d
Successfully built chirp-modbus
Installing collected packages: pyserial, minimalmodbus, chirp-modbus
Successfully installed chirp-modbus-1.0.2 minimalmodbus-2.0.1 pyserial-3.5
dale@firefly:~$
Now use the Python shell to access the sensor (on my laptop, the USB to RS-485 adapter is assigned port /dev/ttyUSB0).
dale@firefly:~$ python3
Python 3.8.10 (default, Mar 15 2022, 12:22:08)
[GCC 9.4.0] on linux
Type "help", "copyright", "credits" or "license" for more information.
>>> import chirp_modbus
>>> sensor = chirp_modbus.SoilMoistureSensor(address=1, serialport='/dev/ttyUSB0')
>>> sensor.getMoisture()
277
>>> sensor.getTemperature()
25.1
>>>
dale@firefly:~$
I have been investigating “Sub-1 GHz Wireless” (also known as “the 900 MHz ISM band”) for a new product proof-of-concept. The use-case is a network of 5 to 50 sensor nodes that send data to a hub node, where it is stored temporarily on an SD card and then transmitted over WiFi to an internet server for archiving, analysis, and reporting. The wireless technology needs to have a range of 2 to 3 km (sensor-to-hub or sensor-to-sensor), and very low power for a sensor node to have 1+ year operation using a CR2016 or AA primary cell. The hub node does not have the same power limitation, and can be always-on.
I will present the sensor and hub node hardware and software in this post, and in a subsequent post the cloud service that stores, processes and reports on the sensor data.
Sensor-Node Hardware
I’ll admit I’m somewhat of a TI fanboy at the moment, working with TI’s new 32-bit ARM Cortex M4-F development system now for several months. Although I don’t have many other recent comparison points, the experience was trouble-free and has given me no reason to switch from low-cost development boards with integrated debugging, an excellent software development environment, and business-friendly BSD-licensed support software. Consequently I looked first at devices with LaunchPad / BoosterPack support.
I decided to use a Sub-1 GHz transceiver for the best compromise between range and power consumption. Although the choice may have been somewhat arbitrary and naive, not considering such factors such as modulation technique, allowed transmit power, and antenna design, it allowed development to continue and is still the right choice. Sometimes an exhaustive analysis also means never releasing product, which doesn’t help anyone.
Perhaps fortuitously, the only Sub-1 GHz transceiver BoosterPack is the 430Boost-CC110L, which uses the Anaren A110LR09x, a certified FCC/IC/ETSI-compliant module containing a TI CC110L together with a PCB antenna. The CC110L BoosterPack has been available since December 2011, and is currently available in-stock from Digi-Key for $25 (a quick supply chain test). I have also received assurances from Anaren that their customers demand long lifetimes and the A110LR09x will be available for many years to come. As additional risk mitigation, the CC110L is a cost and feature-reduced version of the TI CC1101, which is also available from Anaren in a certified module, should a higher performance device become necessary, or should any supply issues arise (although unfortunately the CC1101 is only FCC/IC certified at this time).
Sensor-Node Software
The 430Boost-CC110L is provided with BoosterStack LITE, an application for the MSP430G2553 MPU. BoosterStack LITE was reportedly derived from the TI SimpliciTI stack to create a light-weight, single-channel protocol to demonstrate creating a simple star network, presumably removing features to be compatible with the MSP430G2553. For new applications, Anaren recommends using the Anaren BaseLink driver library (instead of modifying BoosterStack). However, I don’t understand yet how BaseLink relates to SimpliciTI, and whether a SimpliciTI-based networking would sit on top of BaseLink, the other way round, or if BaseLink is effectively included in SimpliciTI. For a more fully-featured protocol, Anaren recommends simply using SimpliciTI.
I need to build at least a minimal stack for software technology option before deciding which to proceed with.
Anaren BoosterStack LITE
Provided by Anaren with the 430Boost-CC110L as a demo app using the TI MSP430G2553 MPU.
Allows creation of a 3-node network (two sensors and one hub node) compiling with mspgcc, or a 5-node network (four sensors and one hub node) if compiling with IAR. I’m anticipating using a TI MSP432 32-bit ARM processor for production, which should alleviate any practical node limitation.
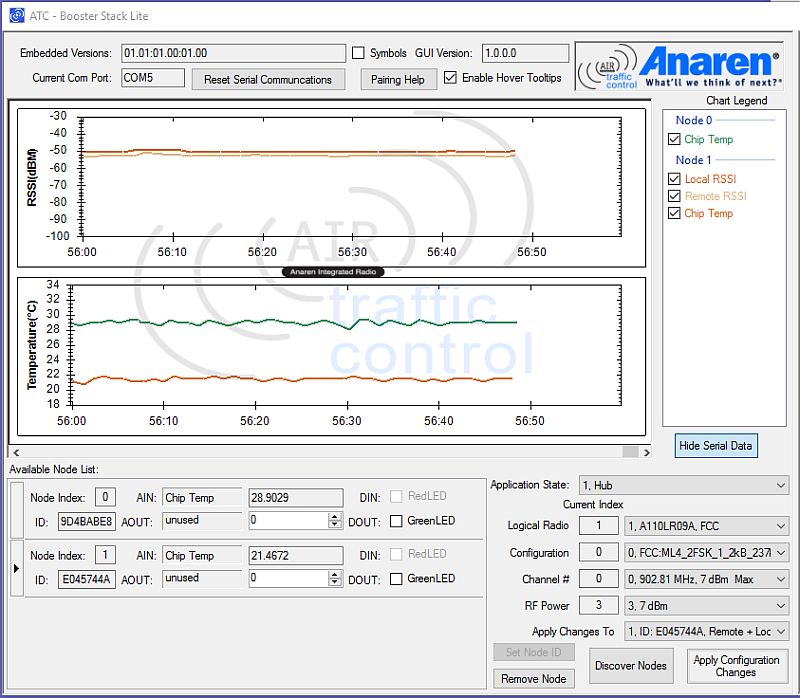
Anaren also provide a PC-based GUI – Air Traffic Control (ATC), but unfortunately ATC is missing features like data logging, and source code is not available.
BoosterStack LITE was reportedly derived from the TI SimpliciTI stack to create a light-weight, single-channel protocol to demonstrate creating a simple star network, and presumably was cut-back in order to use a low-cost MSP432 MPU. The source appears to depend on binary library (mspgcc and IAR versions are provided), but it is not clear if the library source is available.
SimpliciTI™ is a low-power RF protocol aimed at simple, small RF networks. It is open-source software, intended as the basis for building a network with battery-operated devices using a TI low-power RF System-on-Chip (SoC) or an MSP430 ultra-low-power MCU and TI RF transceiver.
Using the 32-but MSP432 MPU should presumably not have any limitation.
SimpliciTI reportedly supports the CC1101, and by inference the CC110L.
LarsRF
LarsRF is a simple RF library for a TI MSP430G2553 LaunchPad and CC110L RF Boosterpack, using the low-level TI SLA3325 library for interfacing to the CC1101. It is BSD licensed in intent, although restricted to TI MPUs and wireless transceiver devices.
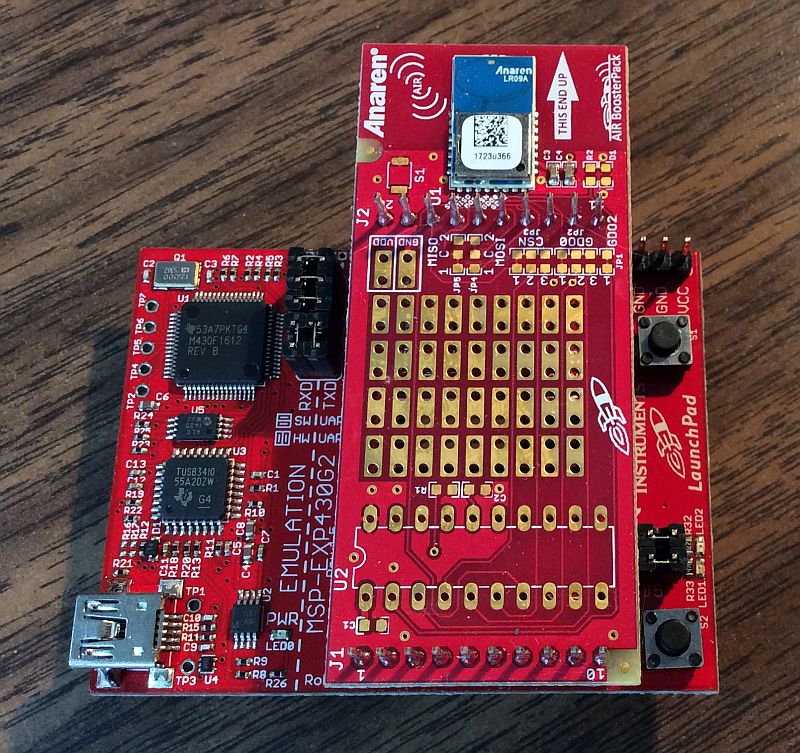
In Phase 1, the 430Boost-CC110L out-of-box demo application is evaluated using the provided pre-programmed MSP430G2553 MPUs (and two MSP-EXP430G2 LaunchPads) in a two-node network (one sensor node and one hub node).
Although the pre-programmed MSP430G2553 MPUs provided with the 430Boost-CC110L Sub-1 GHz transceiver BoosterPacks support a five-node network, the network is effectively constrained to three nodes when the executable is compiled from source using mspgcc (which must be done to use any sensor other than the MSP430 on-chip temperature sensor). Since the use-case requires a network of five to fifty nodes, as well as SD local data storage and internet connectivity, in Phase 2 the MSP430 MPU will be upgraded to an MSP432.
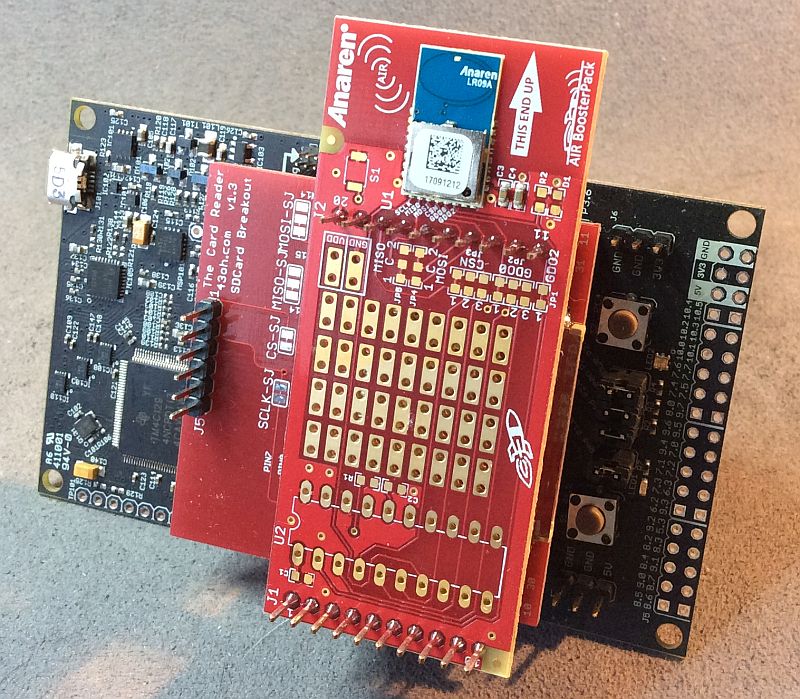
Figure 1 – MSP-EXP430G2553 LaunchPad with 430Boost-CC110L.
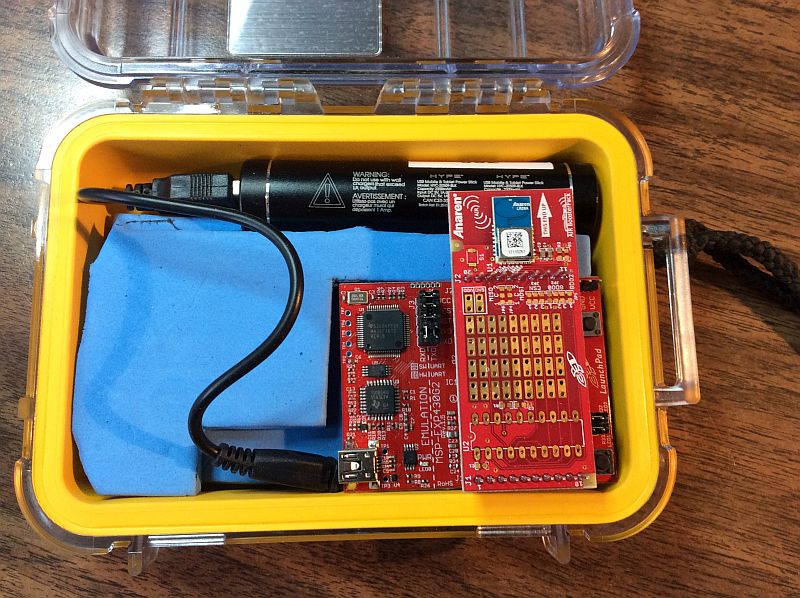
Figure 2 – Using a Pelican Case for Environmental Protection.
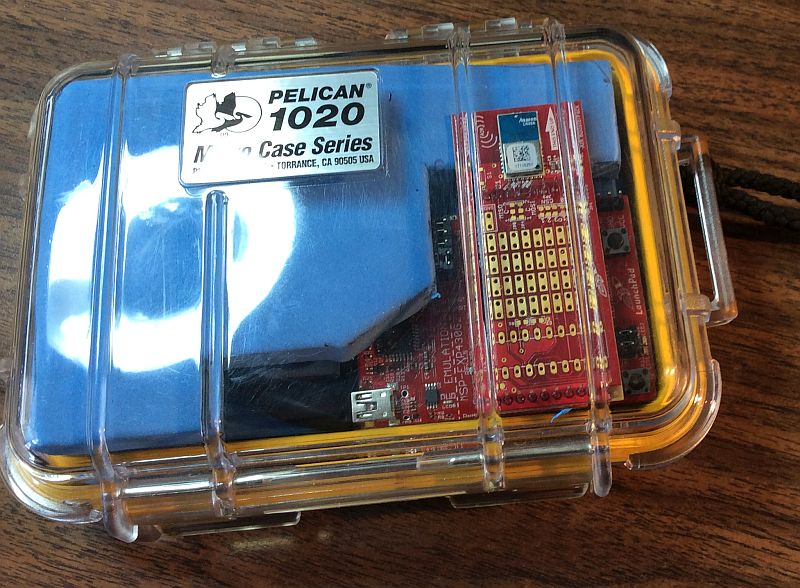
Figure 3 – Ready for the Rain!
Figure 4 – PC GUI (Anaren Air Traffic Controller) showing a 2-node network.
Phase 2 MSP432 Node
In Phase 2, the MSP430 MPU will be upgraded to a 32-bit MSP432P401R (with 64 Kbytes RAM and 256 Kbytes non-volatile memory) to support more than three nodes, as well as local SD data storage and WiFi internet connectivity.
Figure 5 MSP432 LaunchPad with SD card BoosterPack and 430Boost-CC110L.
Sensor-based IoT devices often measure attributes of their environment, such as temperature, battery voltage, signal strength, etc. This data can be presented as a time series, which is a sequence of values obtained at successive points in time. The time between values may be fixed, such as every 1 ms, or it may be irregular or event-driven, such as only times when the value exceeded some threshold.
Many times it can be instructive to view time series data graphically to more readily perceive “the big picture”. Time series data can be plotted using a spreadsheet program (e.g. Excel®) or general purpose numerical analysis application (e.g. R and MATLAB®-compatible GNU Octave). However, a domain-specific program can focus on the job at hand and be more effective.
I naively first thought there would be no shortage of open-source or free-for-use applications to select from, but web searching proved that was not the case. When my eyes started to blur, only GTKWave and DatPlot appeared potentially suitable.
GTKWave
GTKWave was originally developed for viewing Verilog digital-only circuit simulations, although it now can also display real-valued signals. GTKWave will read Verilog VCD/EVCD format files, as well as LXT, LXT2, VZT, FST, and GHW formats. It is provided under the GPL open-source license, and is cross-platform (BSD/Linux, 32-bit Windows®, and OS X®).
GTKWave supports dynamic zooming and panning, has a time marker to display values at a specific time, and can be used with datafiles too large to fit into memory without loss of usability. It is also possible to use GTKWave with streaming data instead of a static input file. However, GTKWave will not read simple delimited text data, such as a CSV-format file. Also, while the vertical axis scales automatically based on the value range of a signal, the scale is not labelled and cannot be set manually.
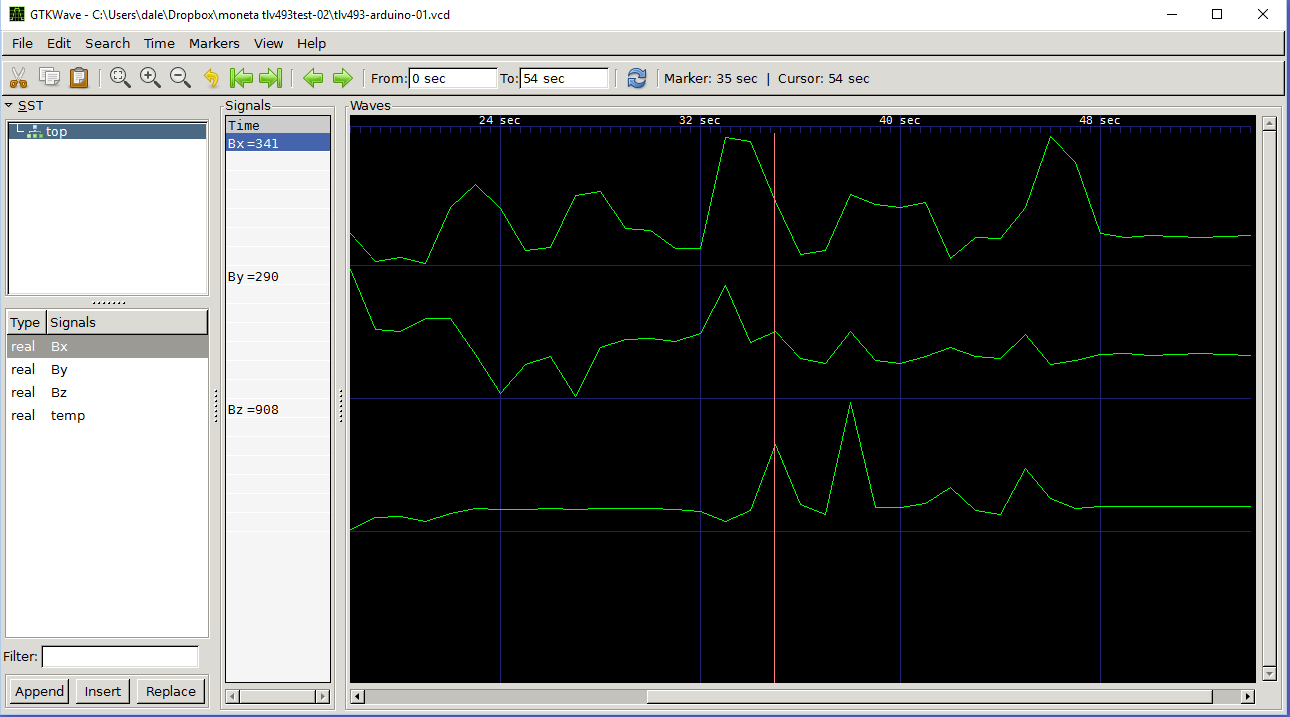
Based on the user manual and provided data files, GTKWave appears to be useable with a large number of signals and very large data sets. The following screenshot shows the magnetic field around a small toroidal magnet.
DatPlot
DatPlot was developed by an aerospace engineer as a better solution for visualizing flight test. The DatPlot tagline is From raw data to report ready plots in under five minutes. Like GTKWave, DatPlot supports dynamic zooming and panning and the vertical plot axis scales automatically like GTKWave, but unlike GTKWave the vertical axis is labelled and an arbitrary number of time markers (called Event Lines) can be displayed. In addition, DatPlot supports annotations which can be used to improve clarity. DatPlot is not open-source, although it is still free to use.
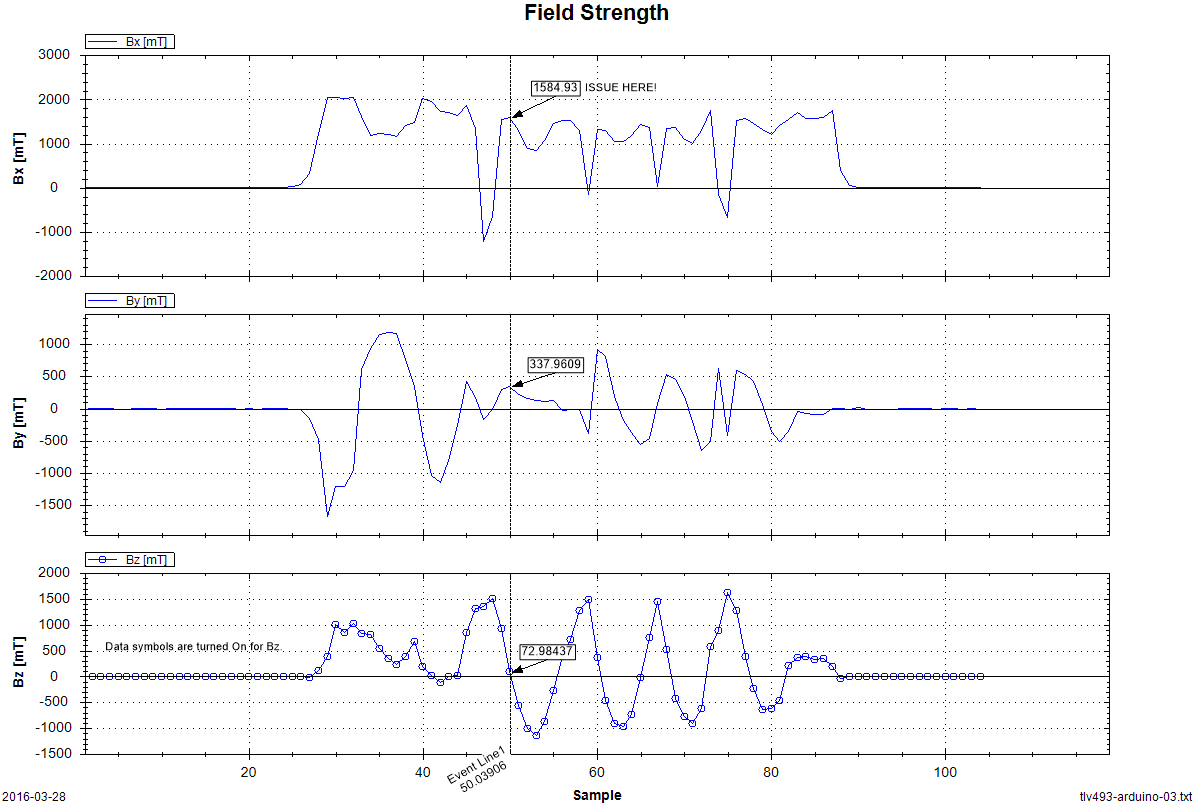
I have not yet been able to explore the usability of DatPlot with a large number of signals (Data Curves) or with very large data sets. The following screenshot again shows the 3D magnetic field around a small toroidal magnet (although not the same dataset shown by GTKWave).
Summary
While GTKWave showed promise based on support for very large data sets, and for being open-source, its lack of vertical scale ultimately made it unacceptable for my immediate use case. GTKWave’s lack of support for simple delimited text files was only a minor inconvenience, as it was not difficult to write data values to a VCD-format data file.
DatPlot does what it claims to do, and is a nice compromise between static graph creation and interactive analysis. I will continue using DatPlot, but a few additional features would really make it shine.
Paging quickly forwards and backwards in time (e.g. by holding down Page Up or Page Down keys, instead of only being able to drag left or right in a Graph Pane).
Display a specific time in a dataset (instead of dragging to the desired point).
Support for CLI operation (e.g. using command parameters or a parameter file to specify source data file, desired Graph Panes and Data Curves, and output image file name).
Epilogue
During my research into a time series data viewing, I came across ROS.org (Robot Operating System). ROS uses bag files to store serialized ROS message data, and provides rqt_bag and rqt_plot utilities to view the data, including plotting fields on a graph. Embedded systems in general (not just robots) often need to store system messages for debugging or forensic analysis, and using the existing ROS bag-file and utilities could save significant effort compared to developing a similar system from scratch.