
Sensor-based IoT devices often measure attributes of their environment, such as temperature, battery voltage, signal strength, etc. This data can be presented as a time series, which is a sequence of values obtained at successive points in time. The time between values may be fixed, such as every 1 ms, or it may be irregular or event-driven, such as only times when the value exceeded some threshold.
Many times it can be instructive to view time series data graphically to more readily perceive “the big picture”. Time series data can be plotted using a spreadsheet program (e.g. Excel®) or general purpose numerical analysis application (e.g. R and MATLAB®-compatible GNU Octave). However, a domain-specific program can focus on the job at hand and be more effective.
I naively first thought there would be no shortage of open-source or free-for-use applications to select from, but web searching proved that was not the case. When my eyes started to blur, only GTKWave and DatPlot appeared potentially suitable.
GTKWave
GTKWave was originally developed for viewing Verilog digital-only circuit simulations, although it now can also display real-valued signals. GTKWave will read Verilog VCD/EVCD format files, as well as LXT, LXT2, VZT, FST, and GHW formats. It is provided under the GPL open-source license, and is cross-platform (BSD/Linux, 32-bit Windows®, and OS X®).
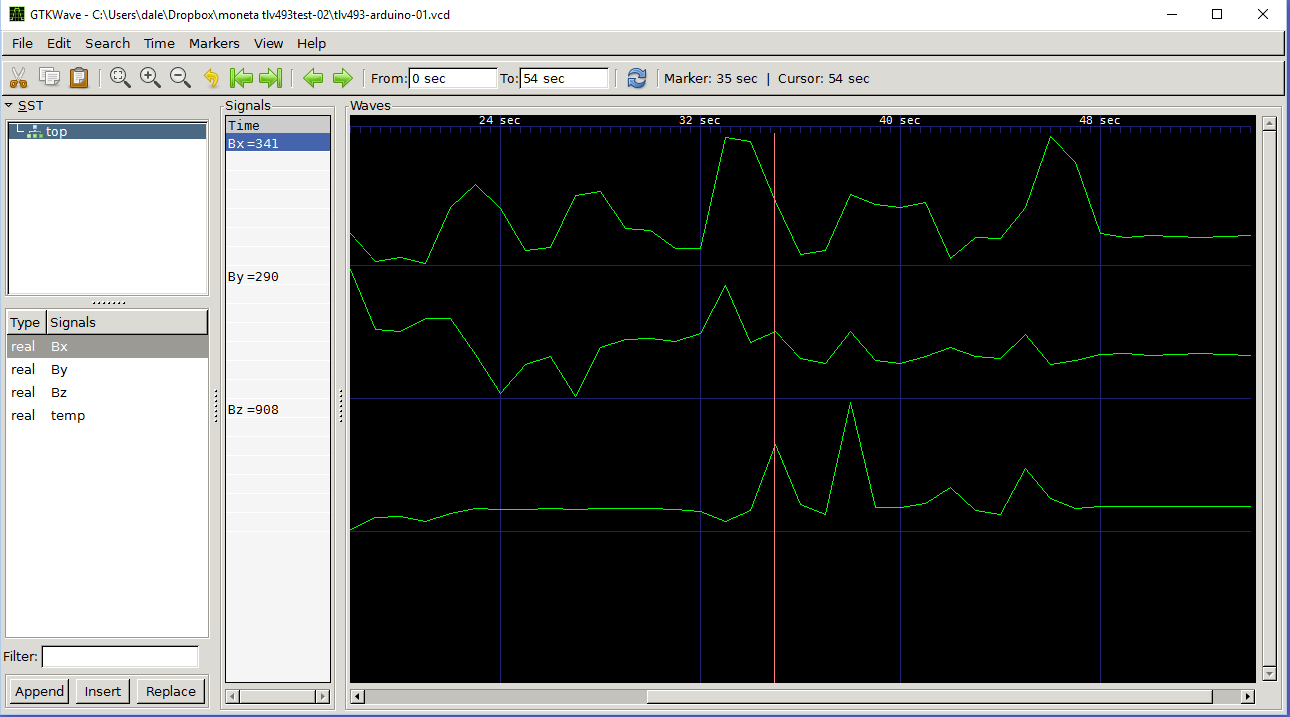
GTKWave supports dynamic zooming and panning, has a time marker to display values at a specific time, and can be used with datafiles too large to fit into memory without loss of usability. It is also possible to use GTKWave with streaming data instead of a static input file. However, GTKWave will not read simple delimited text data, such as a CSV-format file. Also, while the vertical axis scales automatically based on the value range of a signal, the scale is not labelled and cannot be set manually.
Based on the user manual and provided data files, GTKWave appears to be useable with a large number of signals and very large data sets. The following screenshot shows the magnetic field around a small toroidal magnet.
DatPlot
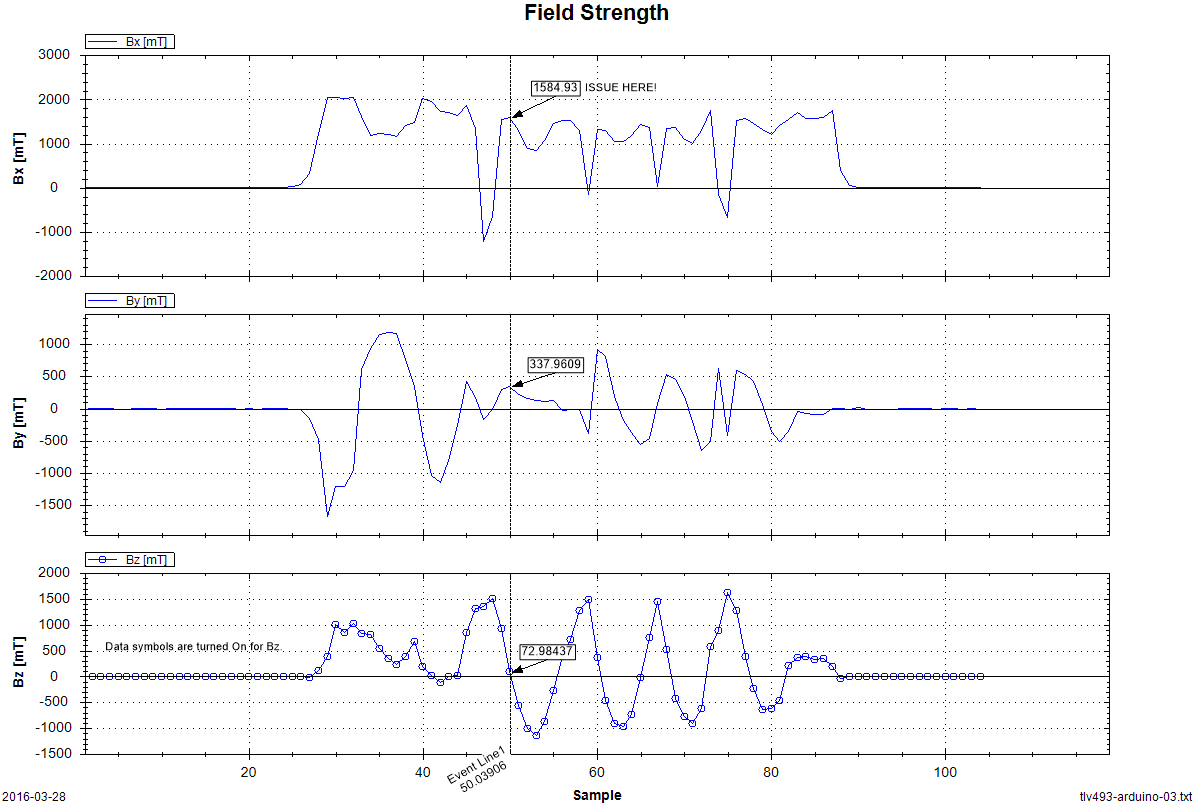
DatPlot was developed by an aerospace engineer as a better solution for visualizing flight test. The DatPlot tagline is From raw data to report ready plots in under five minutes. Like GTKWave, DatPlot supports dynamic zooming and panning and the vertical plot axis scales automatically like GTKWave, but unlike GTKWave the vertical axis is labelled and an arbitrary number of time markers (called Event Lines) can be displayed. In addition, DatPlot supports annotations which can be used to improve clarity. DatPlot is not open-source, although it is still free to use.
I have not yet been able to explore the usability of DatPlot with a large number of signals (Data Curves) or with very large data sets. The following screenshot again shows the 3D magnetic field around a small toroidal magnet (although not the same dataset shown by GTKWave).
Summary
While GTKWave showed promise based on support for very large data sets, and for being open-source, its lack of vertical scale ultimately made it unacceptable for my immediate use case. GTKWave’s lack of support for simple delimited text files was only a minor inconvenience, as it was not difficult to write data values to a VCD-format data file.
DatPlot does what it claims to do, and is a nice compromise between static graph creation and interactive analysis. I will continue using DatPlot, but a few additional features would really make it shine.
- Paging quickly forwards and backwards in time (e.g. by holding down Page Up or Page Down keys, instead of only being able to drag left or right in a Graph Pane).
- Display a specific time in a dataset (instead of dragging to the desired point).
- Support for CLI operation (e.g. using command parameters or a parameter file to specify source data file, desired Graph Panes and Data Curves, and output image file name).
Epilogue
During my research into a time series data viewing, I came across ROS.org (Robot Operating System). ROS uses bag files to store serialized ROS message data, and provides rqt_bag and rqt_plot utilities to view the data, including plotting fields on a graph. Embedded systems in general (not just robots) often need to store system messages for debugging or forensic analysis, and using the existing ROS bag-file and utilities could save significant effort compared to developing a similar system from scratch.