In this tutorial I will install Tryton. Tryton is open source business software of the type popularly known as ERP (Enterprise Resource Plannning). ERP is often considered accounting or finance software, but this is only one function.
The real value of ERP software is achieved when it is used to share information and manage business processes within an organization as a whole, including engineering product development and product lifecycle management (PLM), supply chain, purchasing, and inventory control, manufacturing and material requirements planning (MRP), sales planning and customer relationship management (CRM).
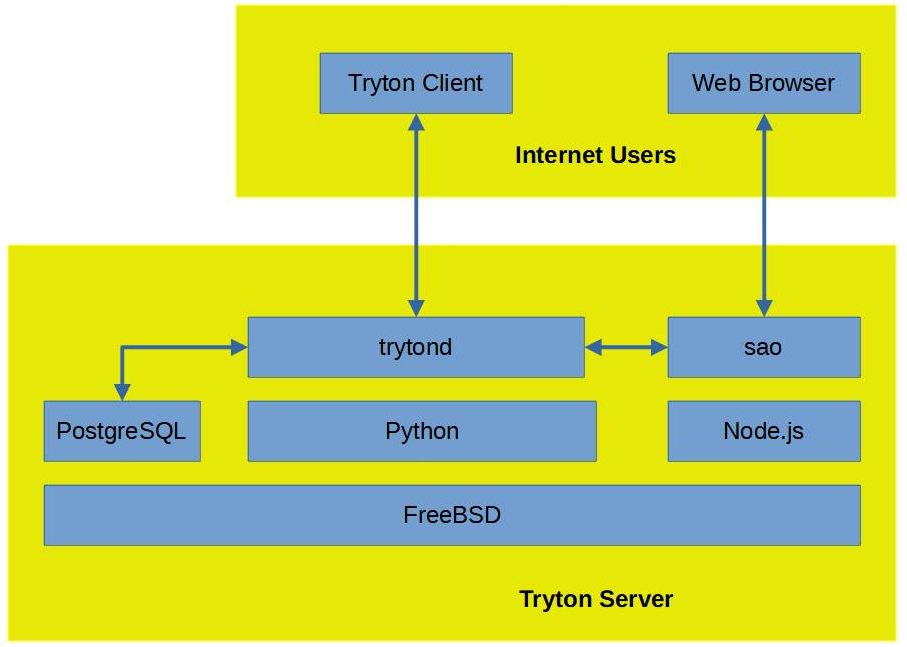
Tryton follows a three-tier architecture model consisting of:
- The Presentation Tier
- tryton, the Tryton desktop client for Windows, Mac OS or Linux.
- sao, the Tryton web client (also known as the Tryton web site).
- The Application Tier
- trytond, the Tryton server daemon.
- The Data Tier
- SQLite, for development testing, or
- PostgreSQL, for production use.
Install FreeBSD 13
Install FreeBSD 13 using suitable media and perform typical initial configuration. Create an initial admin user in the install wizard and include them in the wheel group.
After booting into the new system and logging in as the admin user, copy a public ssh key for the admin user to ~/.ssh/authorized_keys and disable ssh password authentication in /etc/ssh/sshd_config for security.
% su -
# vi /etc/ssh/sshd_config
...
# Change to no to disable PAM authentication
ChallengeResponseAuthentication no
...
# service sshd restart
Update FreeBSD and package manager database for third-party software (when FreeBSD is first installed pkg is a shim, when run it will first install the current version of pkg).
# freebsd-update fetch
# freebsd-update install
# pkg update
Install sudo for more convenient system administration instead of having to “su” to root.
# pkg install sudo
Configure sudo to allow the admin user (and all other members of the wheel group) to allow use without needing to enter a password for convenience (reasonable on a small system).
# visudo
...
## Uncomment to allow members of group wheel to execute any command
# %wheel ALL=(ALL) ALL

## Same thing without a password
%wheel ALL=(ALL) NOPASSWD: ALL
Install tmux. tmux is a terminal multiplexer, which can also be used to detach processes from their controlling terminals, allowing remote sessions to remain active.
# sudo pkg install tmux
Install Python 3
From version 5.0, Tryton has used Python 3. Since Python is not included in the FreeBSD base system, it must be installed seperately.
Install the python3 package, which currently installs Python 3.8.
% sudo pkg install python3
Install py38-pip, the corresponding version of the Python package manager. pip will be used to install trytond and trytond modules from PyPI (the Python Package Index).
% sudo pkg install py38-pip
Install system dependencies
trytond requires libxml2, an XML C parser and toolkit, and libsxlt, an XSLT C library. Graphviz is a package of open-source tools for drawing graphs required by sao, the Tryton web client, which will be installed later in a seperate post.
% sudo pkg install libxml2
% sudo pkg install libxslt
% sudo pkg install graphviz
bash (the Bourne Again SHell) is required to use Python’s built-in venv module, which will be used to create a virtual environment for executing trytond.
% sudo pkg install bash
Install SQLite
Tryton uses the SQLite database management system for development testing, and PostgreSQL for production operation. SQLite has few dependencies and is less complicated to use than PostgreSQL, and will be installed here for initial bring-up testing. PostgreSQL will be installed later for production use.
Install the Python SQLite package.
% sudo pkg install py38-sqlite3
Install trytond
For production use, best practices would indicate a dedicated user should be created for executing trytond, and the users’ home directory used to install trytond and for storing document attachments. However, for simplicity a normal user and home directory will be used.
Create a directory for installing trytond in.
% sudo mkdir -p ~/work/trytond
Create a virtual environment for executing trytond.
% cd ~/work/trytond
% bash
$ python3 -m venv env
$ source env/bin/activate
(env) [~/work/trytond]$
Install trytond using pip.
(env) [~/work/trytond]$ pip install trytond
Install the trytond-product module which will provide the basic functionality needed to create products (part numbers or sku’s).
(env) [~/work/trytond]$ pip install trytond-product
trytond modules can have dependencies, which will also installed when a module is installed. To see all the trytond modules which have been installed, use pip to list installed modules and grep for trydond.
(env) [~/work/trytond]$ pip list | grep trytond
trytond          6.2.3
trytond-company  6.2.0
trytond-country  6.2.0
trytond-currency 6.2.0
trytond-party    6.2.0
trytond-product  6.2.0
(env) [~/work/trytond]$
You can search PiPY for Tryton Framework modules. Refine the search with “trytond” in the search field and sort the results by last updated to list core modules at the top.
trytond reads a trytond.conf configuration file to set operating conditions. trytond has built-in defaults which will configure using a local SQLite database and allow client access from the local system. I will use SQLite for initial bring-up testing, but will use a remote client for access.
By default, trytond will only listen to the local system for connections. To allow connecting from a remote system, create ~/work/trytond/trytond.conf with the following content:
[web]
listen=0.0.0.0:8000
By default, trytond will use an SQLite database which is convenient for developers. Also by default, trytond will expect the database to be found in ~/db/.
Create an empty SQLite database file,
% mkdir ~/db
% touch ~/db/test_db.sqlite
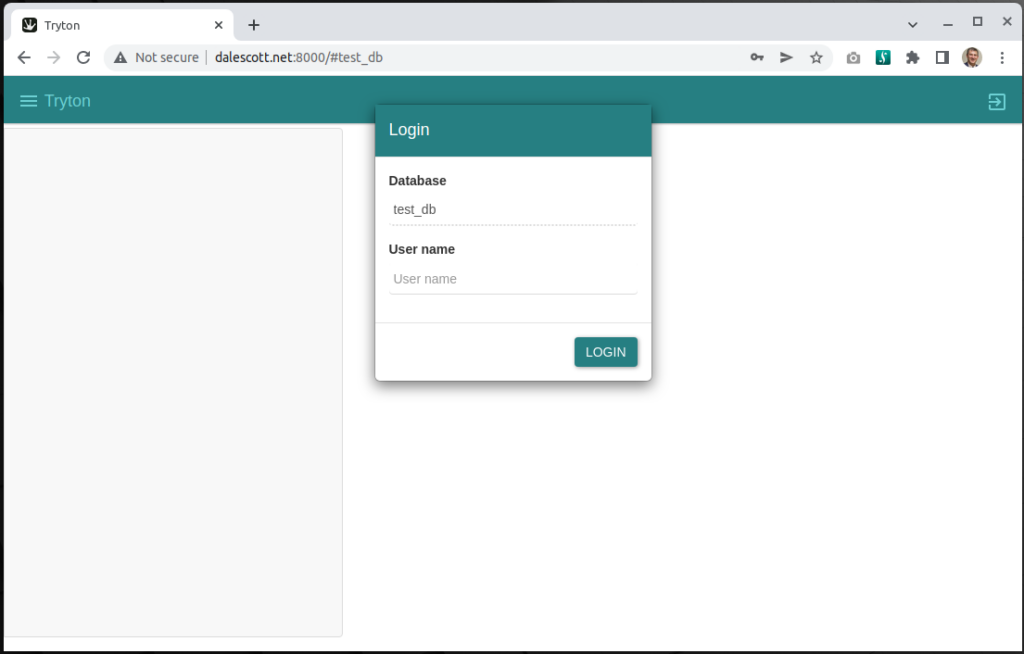
and then initialize the database using trytond-admin. tryton-admin will prompt for a password for the initial admin user which it will enter in the database. The password will be used later to login using the Tryton client as user admin.
(env) dale@starlord:~/work/trytond$ env/bin/trytond-admin -c ./trytond.conf -d test_db --all
"admin" email for "test_db": dale@dalescott.net
"admin" password for "test_db":
"admin" password confirmation:
(env) dale@starlord:~/work/trytond$
Start trytond
Start tmux, which will allow trytond to be started and remain running if the ssh connection or login is broken, and all the shell actity while the connection was broken can still be seen after re-connecting.
(env) dale@starlord:~/work/trytond$ tmux
trytond listens on port 8000, ensure the port is open and or forwarded if you are using a virtual machine.
Start trytond.
(env) dale@starlord:~/work/trytond$ env/bin/trytond -c ./trytond.conf -d test_db
25690 34374492160 [2022-01-19 20:16:19,365] WARNING werkzeug  * Running on all addresses.
   WARNING: This is a development server. Do not use it in a production deployment.
25690 34374492160 [2022-01-19 20:16:19,366] INFO werkzeug  * Running on http://10.0.2.15:8000/ (Press CTRL+C to quit)
Connect using Tryton Desktop Client
Download the latest version of the desktop client from the Tryton project website. The latest version of the client must be used in this case because the latest version of trytond is was installed. The first two digits of the tryton version must be the same as the first two digits of the trytond version. In other words, if trytond is version 6.2.x then the tryton client must be version 6.2.x.
On a Windows system, download and install the latest version of the Windows desktop client, and run as typical. On a Linux system, download the source code for the latest version of tryton appropriate for the system, extract to a convenient location and execute …/bin/tryton.
After the Tryton desktop client starts,
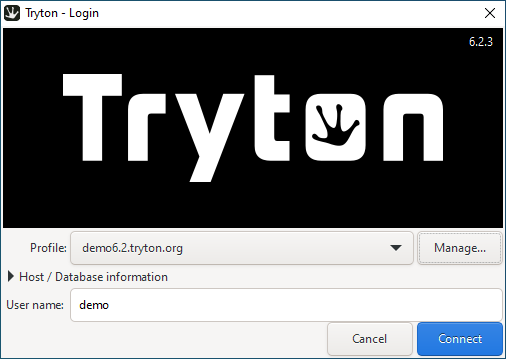
click the Manage button to create a new profile to access the newly installed Tryton site. First click the “+” button to create a new profile, enter a name for the profile (the name is arbitrary) and then the host URL. The client will access the database and populate the drop down with available database names. In this case, test_db will be the only database available.
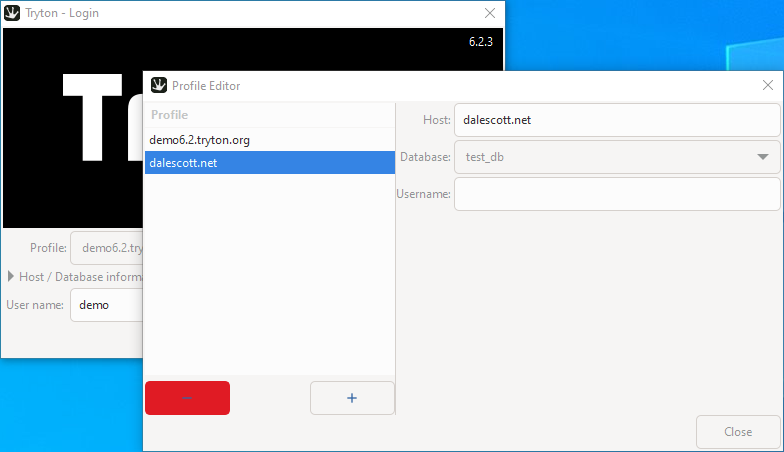
Select Close to return to the Login screen. If you didn’t enter the “admin” user in the profile, enter it now and select Connect. When prompted for the admin user password, enter the password provided to trytond-admin when the database was initialized.
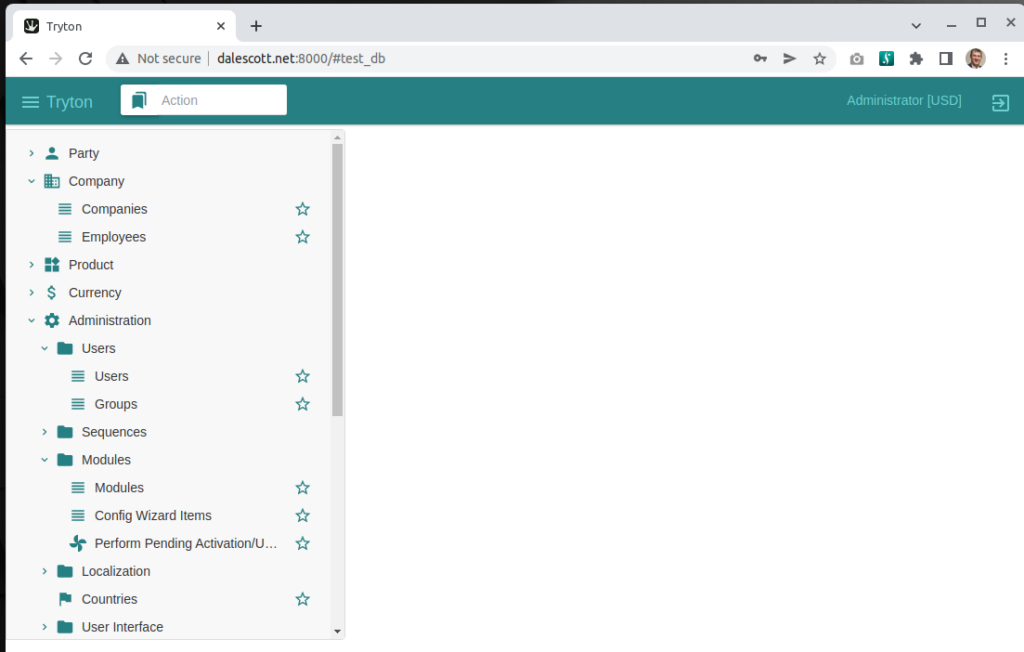
After logging in, a wizard will lead you you through the interactive configuration, including activating the desired modules, define a company and adding users, which will be covered in a separate post.
Tryton Client Options
The Tryton client has several command switches that may be useful if debugging Tryton operation or developing Tryton modules.
tryton -d {-v} {-l [DEBUG | INFO | WARNING | ERROR | CRITICAL]}
-d development mode (disable client-side caching)
-v verbose
-l log level