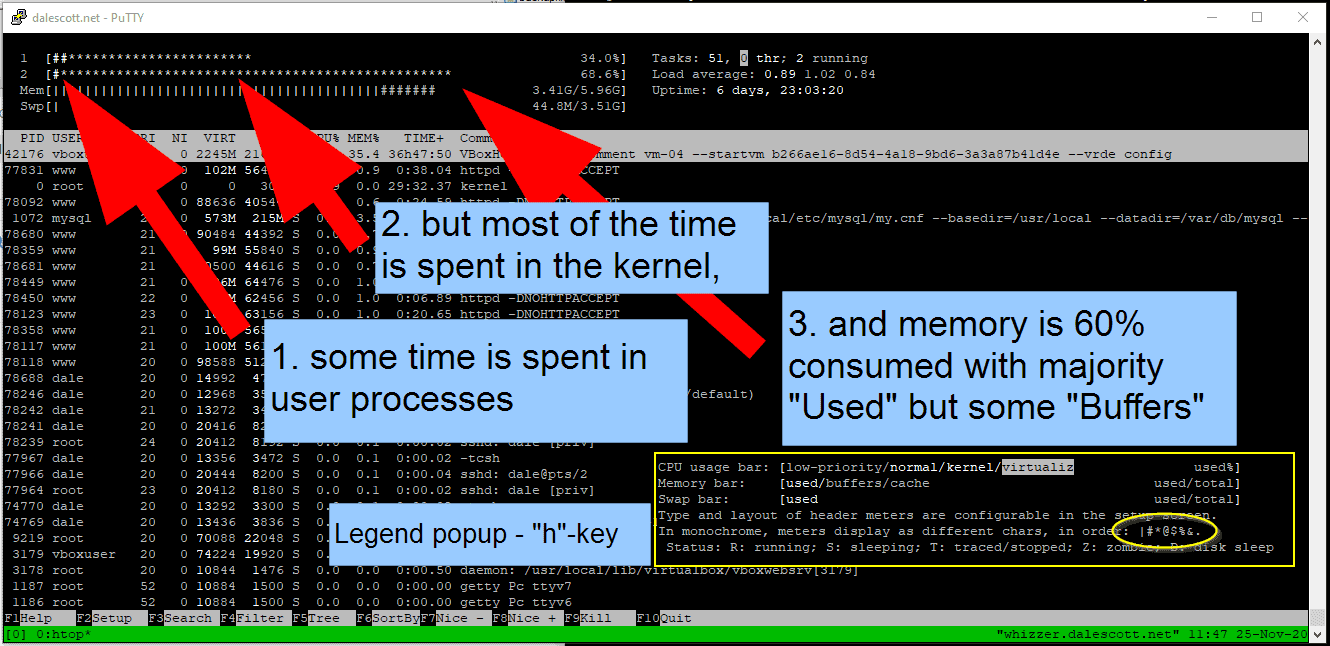
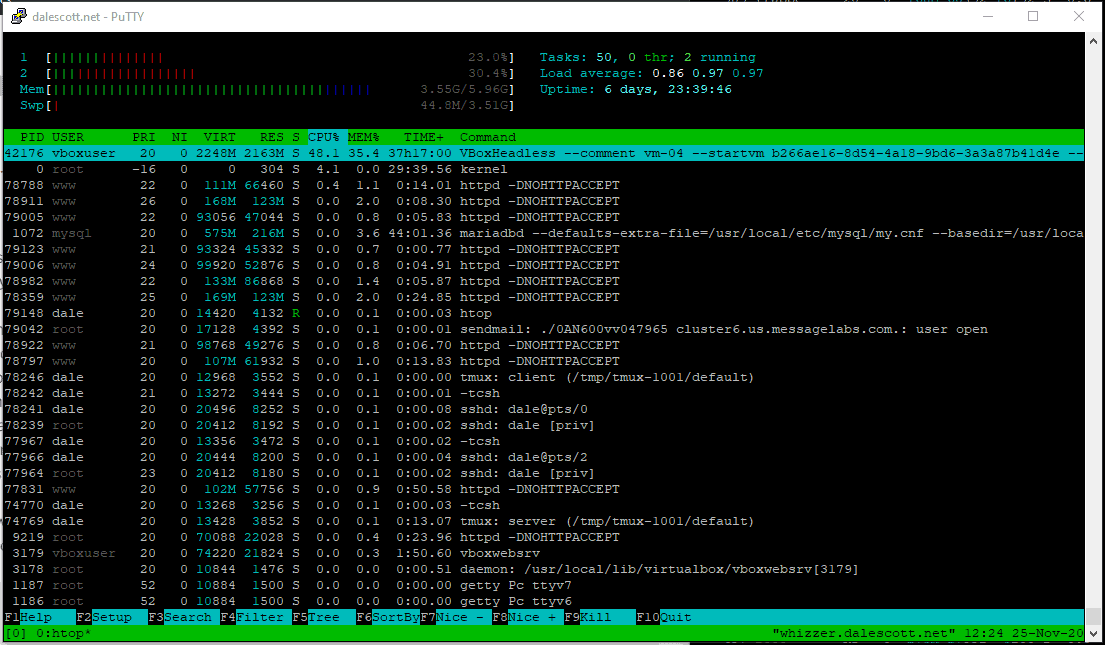
htop is a great tool for viewing the basics of what a server is doing, in particular the real-time CPU and memory graphics. However, the colors in the bar graphs can make it difficult to distinguish between CPU tasks being executed (low-priority, normal, kernel and virtualiz), and the type of memory in use (used, buffers and cache).
In this case, the “no-color” option can be used which causes the bar graphs to use characters instead of colors for sub-categories.
% htop -C