I recently replaced the server for dalescott.net after a drive failure using a faster system, but my initial perception was that it was slower!
The “new” server is a Intel Core2 CPU 6600 2.40GHz with 6GB of RAM. In addition to the services running on bare metal, VirtualBox is used to host ERPNext using one core and 2GB RAM. It was the ERPNext response that seemed particularly slow. Investigating, I found a combination reasons as is typical of most problems.
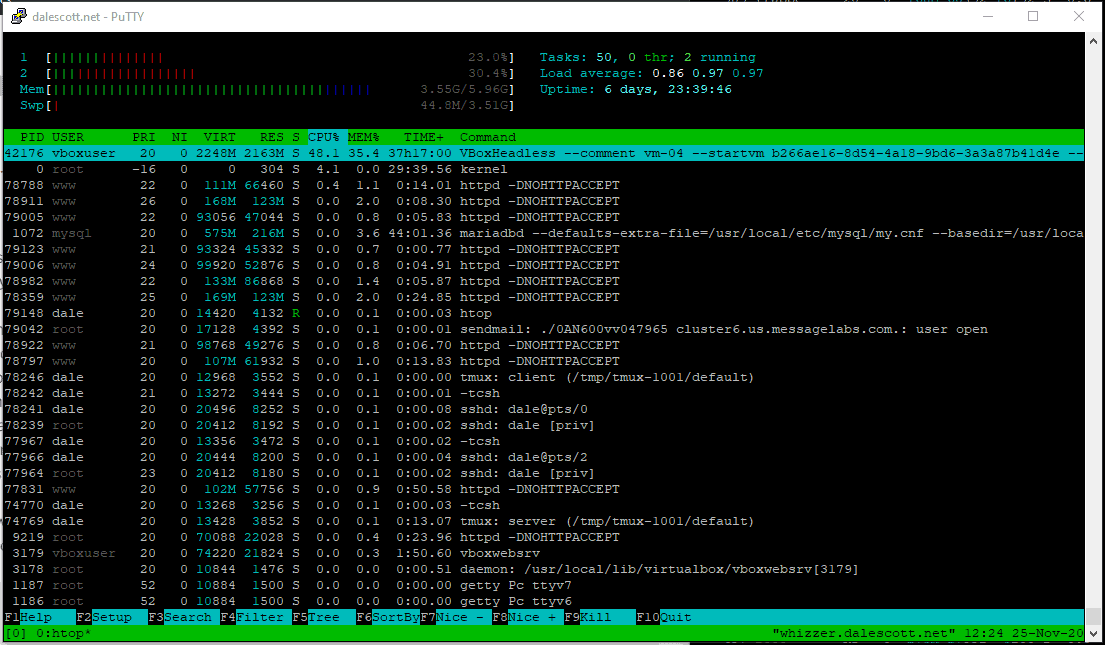
First, I examined the apache logs and found the server was the target of a penetration attack around the time I had noticed response was “slow”. The server regularly shows 1000+ penetration attempts in a 24hr period, which tend to occur in clusters. However they have been more an annoyance than a significant concern, as I had not noticed them having a significant effect on server performance. Next, I examined virtual machine performance and found CPU use was 100% when ERPNext was being accessed.
While not finding a definitive cause, it seems likely the additional CPU load from the penetration attack was starving the already high CPU requirements of ERPNext. While clearly ERPNext is processor-constrained, under normal load the server can still provide adequate performance for basic presentations or training with a limited number of concurrent users. However, not if someone is knocking on the front door trying to break in at the same time.
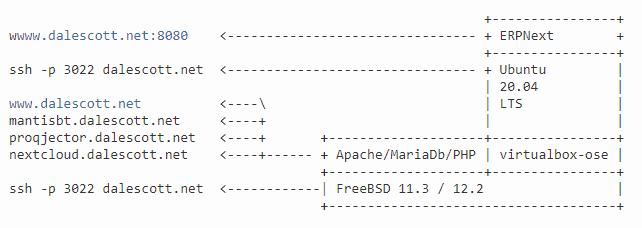
dalescott.net SaaS Architecture
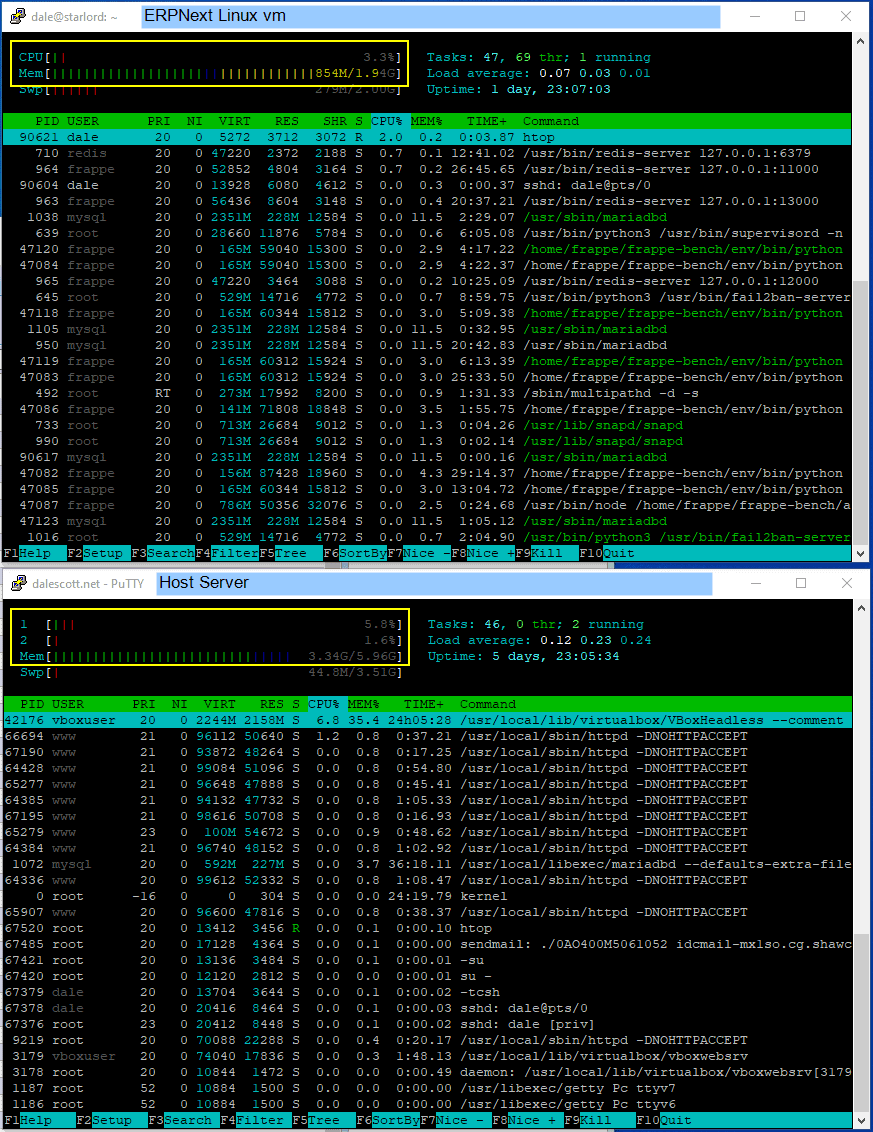
Load At Rest
Below is the virtual machine and host server when at rest (no logged-in ERPNext users, and no on-going brute-force ssh or web app login attempts). The vm load (top) is 3% and the host (bottom) server cores are 5% and 2% (the 2% core is the erpnext server).
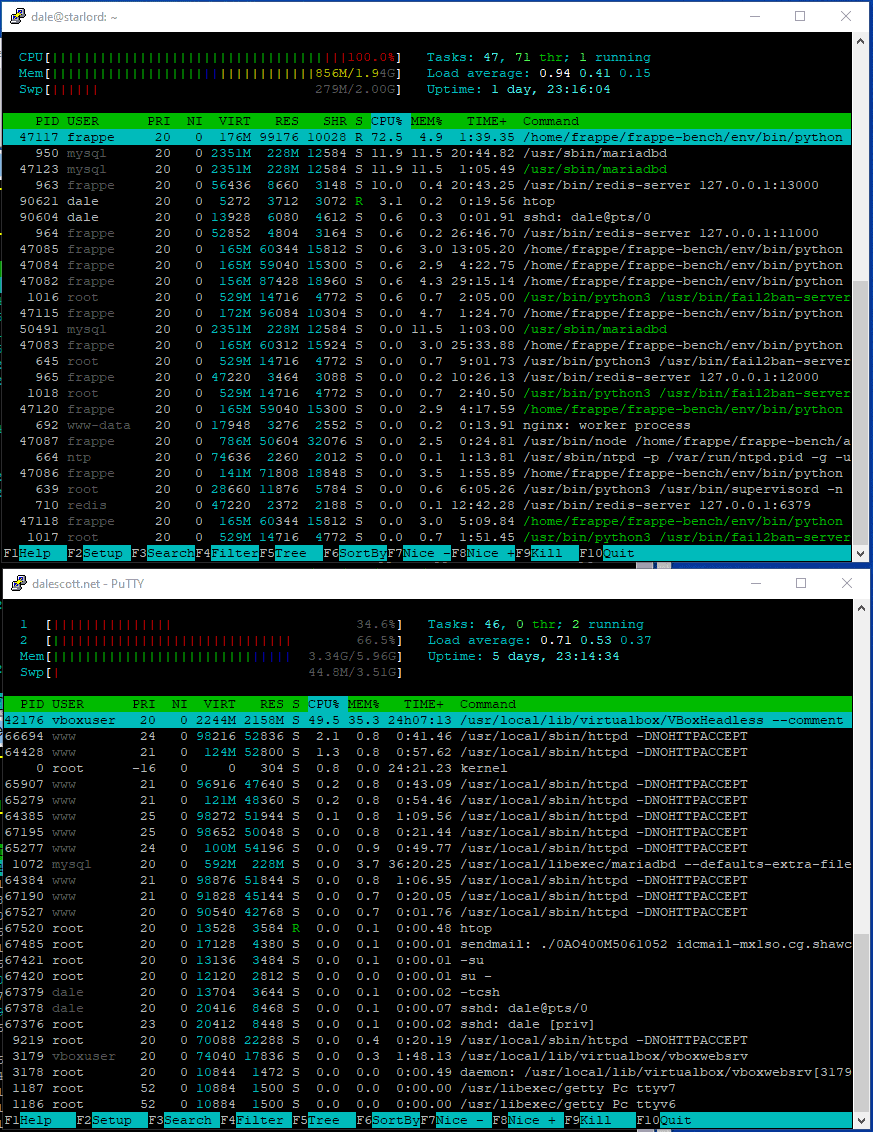
Load When Stressed
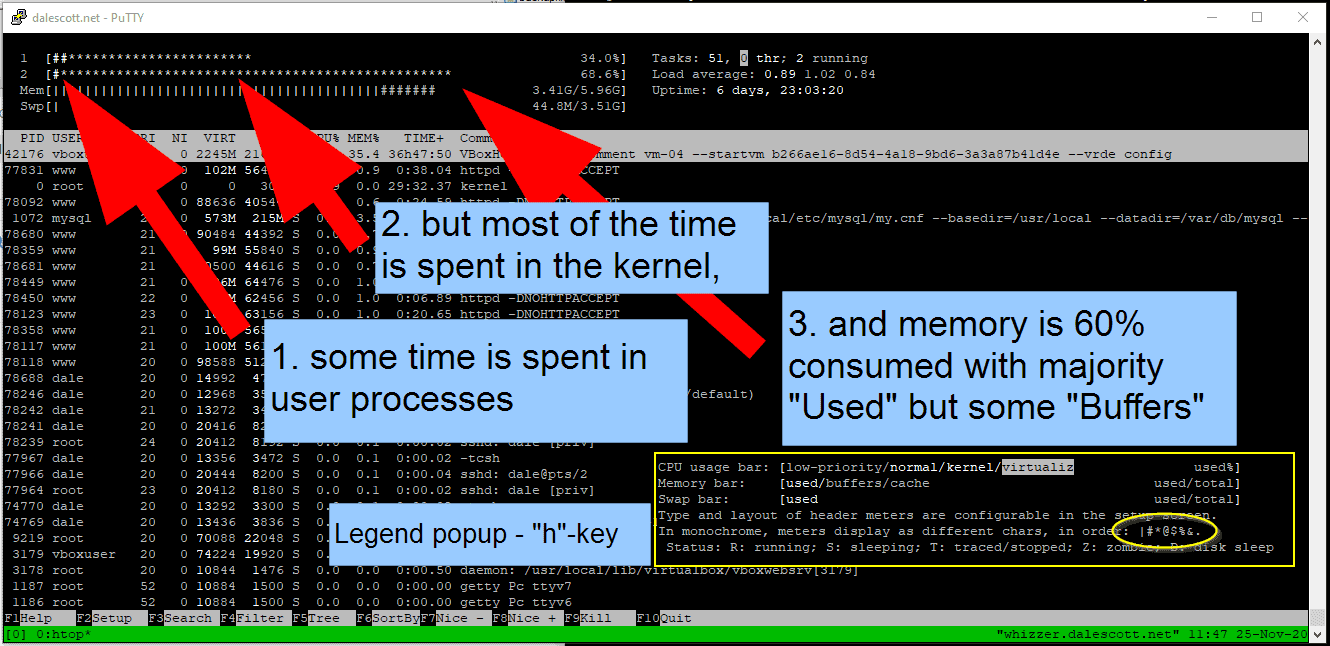
Below is the server when an ERPNext user logs in and accesses an Item list. The vm load (top) has maxed out at 100% and is using half its available memory. On the host (bottom), core #2 is almost 70% (erpnext), but core #1 is only 35% and only half the total available memory is being used, which is good.

